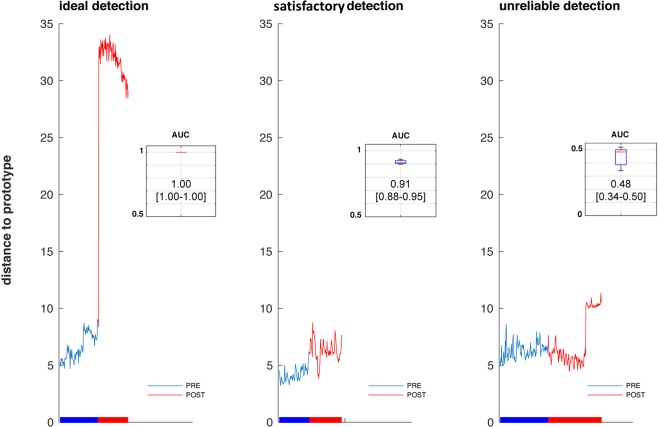
Figure 1.
Examples, from left to right, of a case of perfect detection of changes in brain activity following adjustment of ventilator settings (panel A); of a case of imperfect but excellent detection (panel B); and of a case in which no changes were detected (panel C). In each panel, the tracing represents the Riemaniann distance separating the EEG covariance matrix from the matrices representing the reference period (prototypes). The trace is blue when the matrices are considered as belonging to the reference period; it becomes red when the matrices are considered statistically significantly outside of this class. The horizontal bar below the tracing indicates the passage from the ‘PRE’ (before ventilator adjustment) to the ‘POST’ (after ventilator adjustment) condition. On the top right corner of each panel, a cartouche depicts the performance of the classifier to separate the ‘PRE’ and ‘POST’ periods according to the statistical distance, in terms of the corresponding area under the curve (the box delineates the interquartile range of the AUC with indication of its median; the whiskers correspond to the 90th percentile/95th percentile/extreme values).

