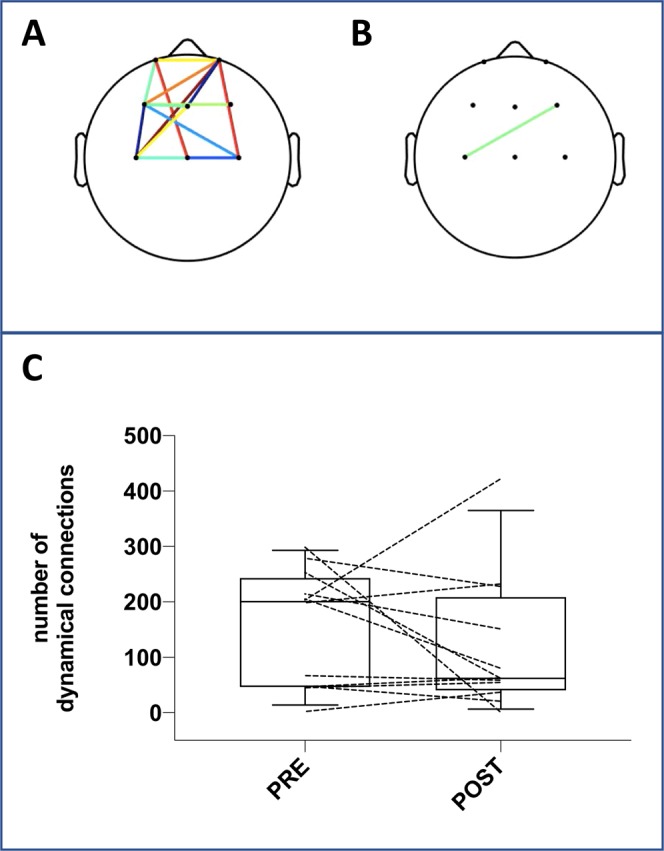
Figure 2.

Connections between pairs of channels before the adjustments of ventilator settings (A) and after these adjustments (B) in a patient (#6) in whom the performance of the Riemannian classifier yielded an AUC of 1 (same patient as in Fig. 1 panel A). See the corresponding video file provided in electronic supplement. (Panel C) Shows the total number of connections during each recording period (before and after adjustments of ventilator settings) in the overall population (the boxes delineate the interquartile range with indication of the median; the whiskers correspond to the 90th percentiles of the distribution; dotted lines correspond to individual patients).
