Fig. 5.
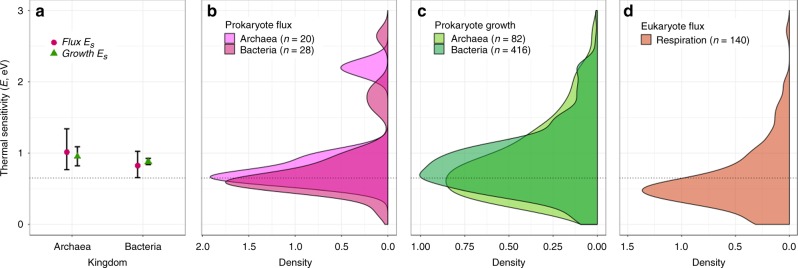
Differences in short-term thermal sensitivity across taxonomic groups. a Comparison of the intra-specific thermal sensitivity () for growth (green triangles) and metabolic fluxes (purple circles). Error bars represent 95% CIs. CIs for growth rate thermal sensitivity fall within those for metabolic fluxes, and each sit above 0.65 eV (dotted line) for both archaea and bacteria (bacteria growth = 0.88 eV, n = 416; bacteria flux = 0.82 eV, n = 28; archaea growth = 0.95 eV, n = 82; archaea flux = 1.01 eV, n = 20). b Density plot of flux values for archaea and bacteria. c Density plot of growth rate values for archaea and bacteria. d Density plot of values for respiration rate TPCs in autotrophic eukaryotes, showing comparatively lower mean thermal sensitivity than those of the distributions for prokaryotes ( eV, n = 381). Source data are provided as a source data file

