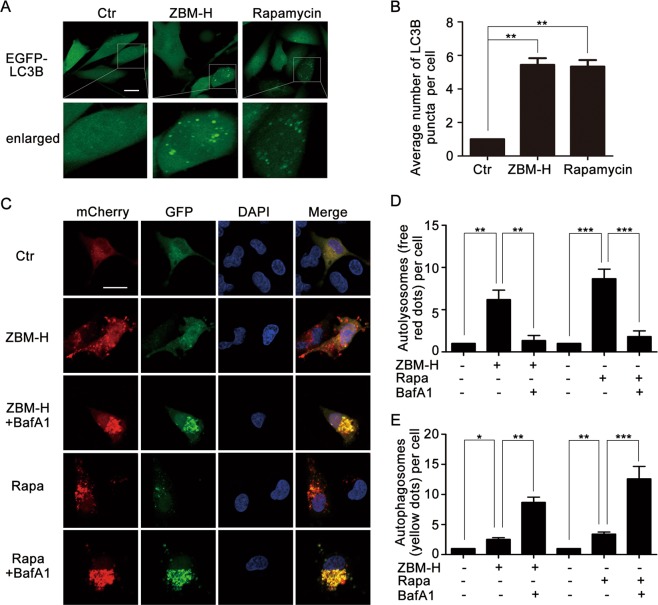
Fig. 3.
ZBM-H promoted autophagy flux in A549 cells. a, b MAP1LC3B puncta was analyzed in U87 cells treated with ZBM-H (2 μM) and Rapamycin (2 μM) for 6 h. Scale bar: 20 μm. c–e A549 cells were transfected with mCherry-GFP-LC3B for 24 h, followed by treatment with ZBM-H, Rapamycin and Baf-A1. The fluorescence signals were visualized by confocal microscopy. Scale bar: 20 μm. Data are presented as the mean ± SEM, *p < 0.05, **p < 0.01, ***p < 0.001

