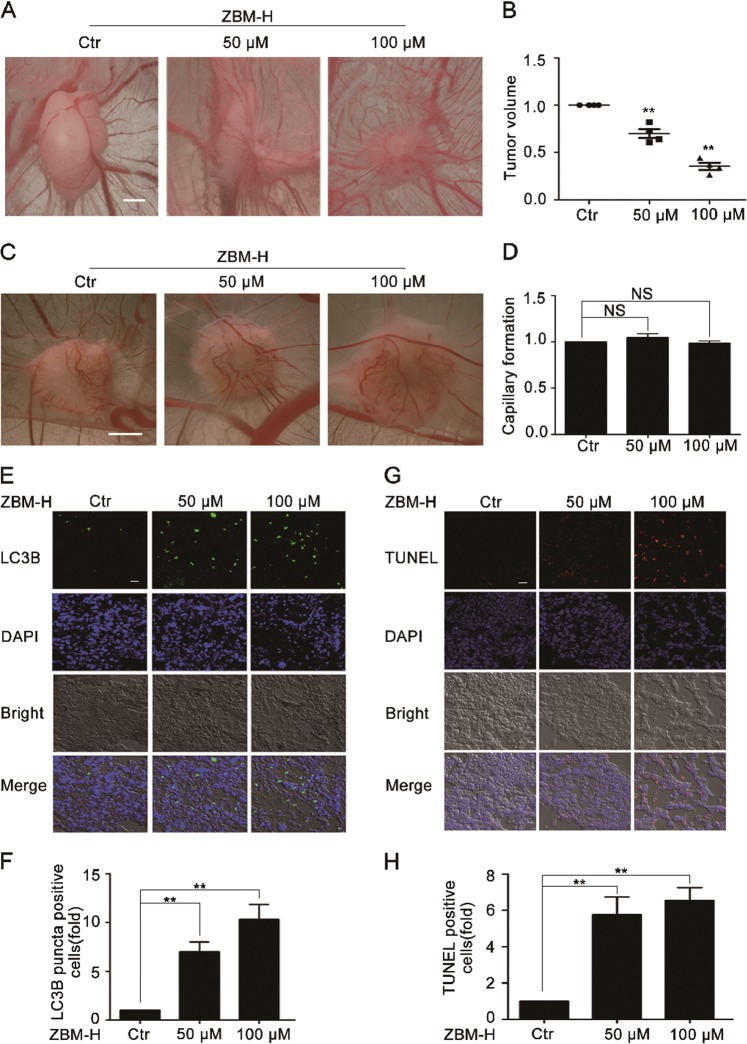
Fig. 8. ZBM-H inhibited lung cancer growth in vivo.
a, b Biomicroscopy and quantification of the tumors treated with ZBM-H at indicated concentrations. Scale bar: 1.5 mm. c, d Biomicroscopy and quantification of angiogenesis on gelatin sponge with ZBM-H adsorption. e, f Immunohistochemistry (IHC) staining LC3B puncta of the frozen tumors sections. Scale bar: 20 μm. g, h terminal deoxynucleotidyl transferase-mediated dUTP nick-end labeling (TUNEL) staining of the frozen tumors sections. Scale bar: 20 μm. Data are presented as the mean ± SEM, NS p > 0.05, **p < 0.01, n = 3

