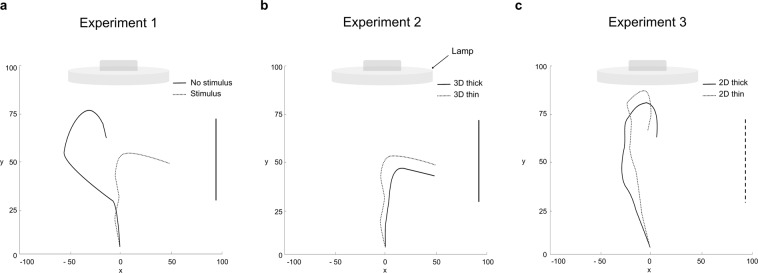
Figure 3.
Representative examples of spatial trajectories exhibited by the apex for the different experiments. Panel (a) depicts the comparison between the 3D stimulus versus the no stimulus condition. Note that for the 3D stimulus condition the apex veered towards the support whereas for the no stimulus condition the apex grew up to a certain stage and then fell down. Panel (b) depicts the comparison between the thin and the thick 3D stimulus. For both conditions the apex veered towards the stimulus. The vertical solid line represents the 3D stimulus. Panel (c) depicts the comparison between the thin and the thick stimulus presented in 2D. For both conditions the apex grew up to a certain point and then fell down. The vertical dashed line represents the 2D stimulus. Axis x = sagittal axis in mm; axis y = vertical axis in mm.

