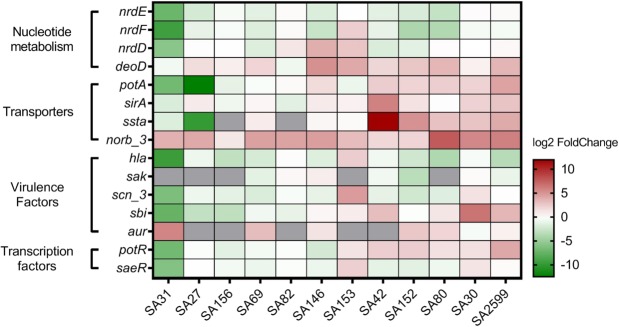
Figure 3.
Confirmation of S. aureus gene expression dysregulation by P. aeruginosa. Twelve clinical SA-PA strain pairs were co-cultivated for 4 hours. RNAs were extracted and RT-qPCR were performed on 15 genes. The results are represented as fold change of expression (gene relative expression in coculture/gene relative expression in monoculture) on a heatmap. Under-expressed genes are indicated in green whereas over-expressed genes are indicated in red. No RNA detection is shown in grey. Pairs were hierarchically clustered by the Euclidean method.

