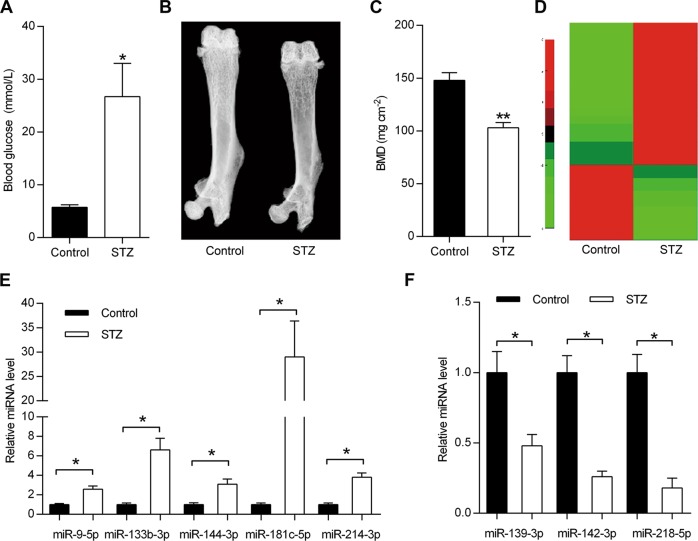
Fig. 1. Identification of differentially expressed miRNAs in bone tissues from WT and diabetic mice.
a The measurement of blood glucose concentrations in STZ-induced diabetic mice and control WT mice (n = 5). b Representative dual-energy X-ray images of mouse femur from STZ-induced diabetic mice or control mice. c Bone mineral density (BMD) of STZ-induced diabetic mice or control mice (n = 5). d Heatmap of differentially expressed miRNAs of bone specimens from STZ-induced diabetic mice or normal mice. e, f qRT-PCR analysis of miRNA expression in bone specimens from STZ-induced diabetic mice or control mice (n = 3). All data are expressed as mean ± SEM, *p < 0.05, **p < 0.01

