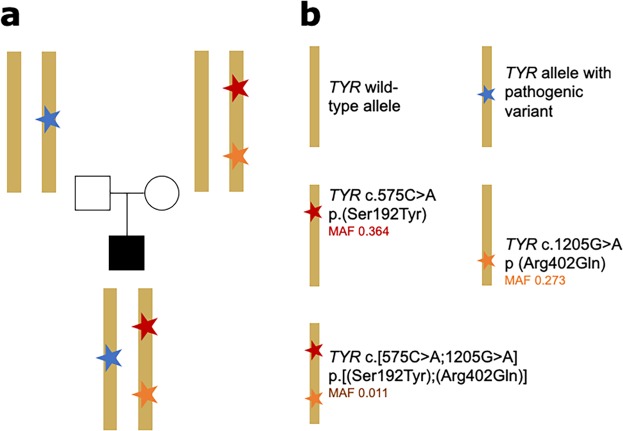
Figure 2.
Schematic representation of the formation of the TYR c.[575 C > A;1205 G > A] p.[(Ser192Tyr);(Arg402Gln)] complex allele. (a) Basic pedigree including parental haplotypes from an individual (proband 6) carrying the TYR complex allele (red & orange stars) in trans with a TYR pathogenic allele (blue star). (b) Figure key for (a) explaining the variants present in each allele. Notably, each of c.575 C > A p.(Ser192Tyr) and c.1205 G > A p (Arg402Gln) has been shown to predispose to decreased pigmentation40,41 and to result in reduced tyrosinase activity11. The minor allele frequencies (MAF) shown for these two variants are from the gnomAD variant database25 (accessed 23/01/2019, European non-Finnish population). The MAF shown for the c.[575 C > A;1205 G > A] p.[(Ser192Tyr);(Arg402Gln)] complex allele is estimated using data from the “British in England & Scotland” subset of the 1000 genomes project3.

