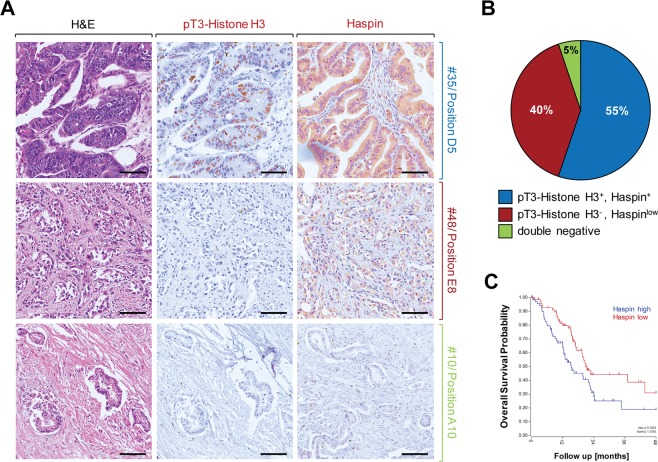
Figure 3.
Increased Haspin activity and expression in PDA can be linked to overall survival probability. (A,B) Tissue microarrays (n = 58 PDA samples) were analyzed by IHC for Haspin or its phosphorylated target Histone H3 using anti-Haspin or anti-pT3-Histone H3 antibodies. (A) Shows representative tissues that express Haspin and pT3-Histone H3 (top row), only express Haspin at low level (middle row), or are double negative for both (bottom row). (B) Shows a quantification n = 58 samples. (C) Overall survival probability of patients either expressing Haspin at high levels (n = 74 samples) or low levels (n = 72 samples). Shown is a Kaplan Curve using TCGA data (GSG_83903; expression cutoff: 29.2540).

