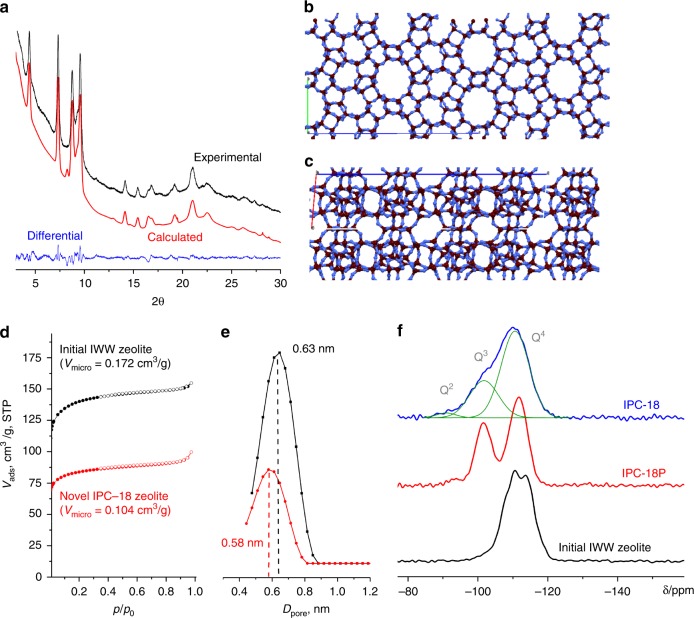
Fig. 2.
Basic characterisation of IPC-18. a XRD patterns of IPC-18: experimental (black), calculated after Rietveld refinement (red), and the difference between them (blue); b, c crystallographic models of IPC-18 in the ab projection demonstrating 12 and 8-ring pores (b), and in ac projection, showing connectivity between layers through S4R units (c); d nitrogen adsorption and desorption isotherms for parent IWW and daughter IPC-18 zeolites; e pore size distribution for initial IWW (black) and final IPC-18 (red); f 29Si MAS NMR spectra of IWW, intermediate IPC-18P and IPC-18 samples

