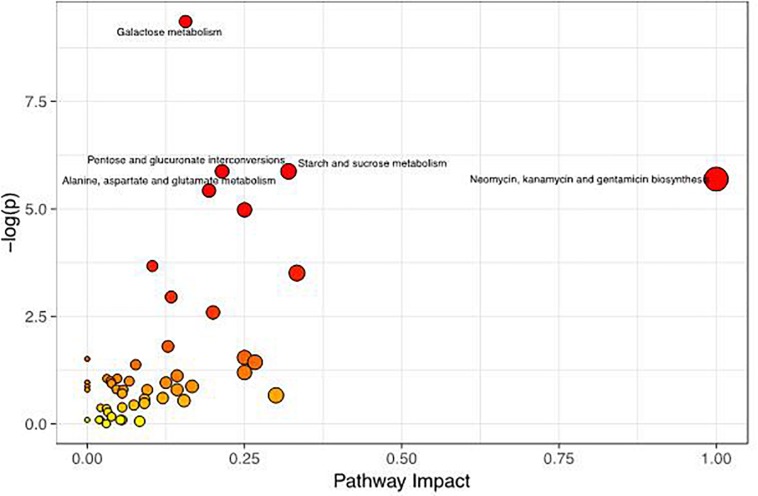
FIGURE 6.
Metabolome map of changes in the common metabolites identified between healthy controls and S. agalactiae-infected cows. The x-axis represents the pathway impact, and the y-axis shows the pathway enrichment. Larger symbol sizes and darker colors indicate greater metabolite numbers and higher pathway impact values, respectively.

