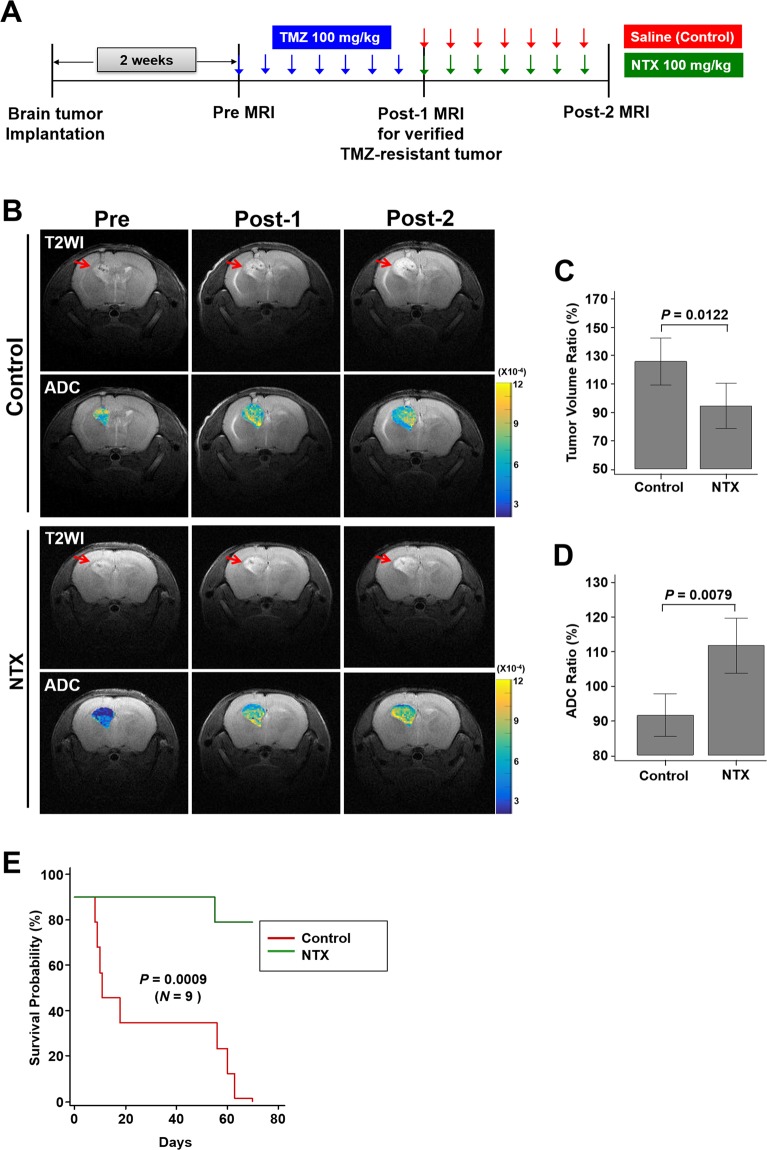
Figure 3.
Short-term in vivo MR study and long-term survival analysis in a TMZ-resistant GBM mouse model. (A) The experimental design for the in vivo MR study (n = 4, in each group). (B) Representative T2WI (1st row) and ADC maps (2nd row) for the control group and T2WI (3rd row) and ADC maps (4th row) for the NTX group, visualized with pretreatment MRI and post-1 MRI to verify TMZ resistance and with post-2 MRI to assess NTX effects. (C) The tumor volume ratio (%) was significantly decreased in the NTX group (P = 0.0122) compared to the control group. (D) The mean ADC ratio was significantly increased (P = 0.0079) in the NTX group. (E) The survival of the NTX group was significantly longer than that of the control group, which was analyzed by Kaplan-Meier survival analysis (n = 9, in each group) [mean, 72.8 days (95% CI, 68.7–76.9) vs 33.9 days (95% CI, 17.1–50.7), P = 0.0009, log-rank test].

