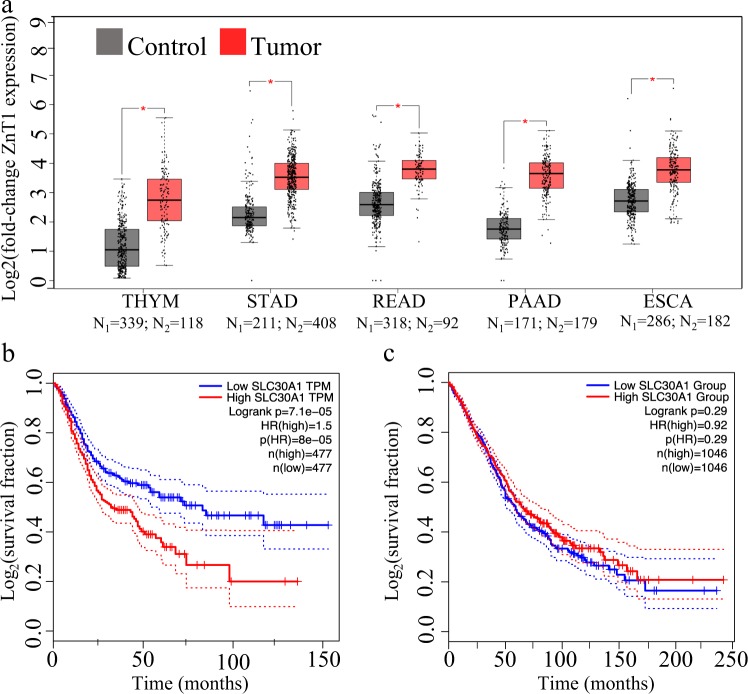
Fig. 2. ZnT1 overexpression predicts dismal prognosis in cancer.
GEPIA expression and survival analyses are presented. a Boxplot representation of ZnT1 expression in five distinct cancer types and healthy controls. Asterisk indicates p-value < 0.005 (ANOVA). THYM-thymoma, STAD-stomach adenocarcinoma, READ-rectal adenocarcinoma, PAAD-pancreatic adenocarcinoma, and ESCA-esophageal carcinoma. b Kaplan–Meier survival plot in the cancers presented (a). c Kaplan–Meier survival plot in five types of cancer (thyroid cancer, ovarian cancer, brain glioma, glioblastoma, and colon adenocarcinoma) with no significant tendency to ZnT1 overexpression. HR signifies hazard ratio. Dashed lines in (b), (c) represent the 95% confidence interval

