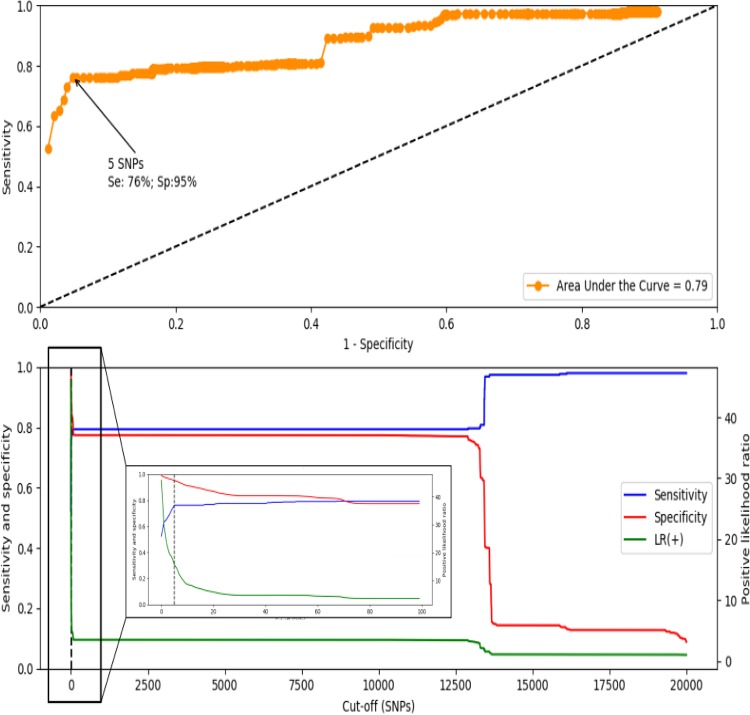
FIG 3.
(Top image) Receiving operator characteristics curve. The area under the curve value is represented at the right corner of the image. (Bottom image) Cumulative distribution analysis showing the effects of variations in the cutoff SNP values on sensitivity (blue line), specificity (red line), and the positive likelihood ratio (green line). A vertical dashed black line shows the threshold corresponding to 5 SNP. A zoomed image of the first 100 cutoffs is displayed inside a box.

