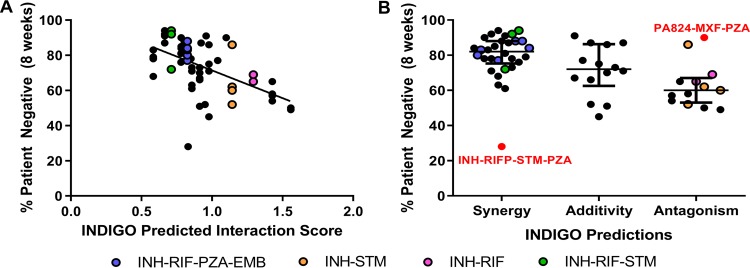
FIG 3.
INDIGO-MTB drug interaction scores correlate with sputum culture negativity at 2 months. (A) Comparison of model predictions with sputum conversion rates in human patients after 8 weeks of treatment in clinical trials (R = −0.55, P ∼ 10−5). Higher patient negative percentages indicate more-effective regimens. Each dot indicates a specific drug combination reported from a specific clinical trial. Dots highlighted in the legend are drug combinations of interest mentioned in the text. (B) Dot plot of sputum conversion rates against the INDIGO-MTB-predicted drug interaction type. The dots labeled in red font denote outlier combinations that were misclassified by INDIGO-MTB. The horizontal lines represent the first quartile, third quartile, and median (the widest horizontal line). The colored dots correspond to combinations highlighted in the legend.

