Figure 4.
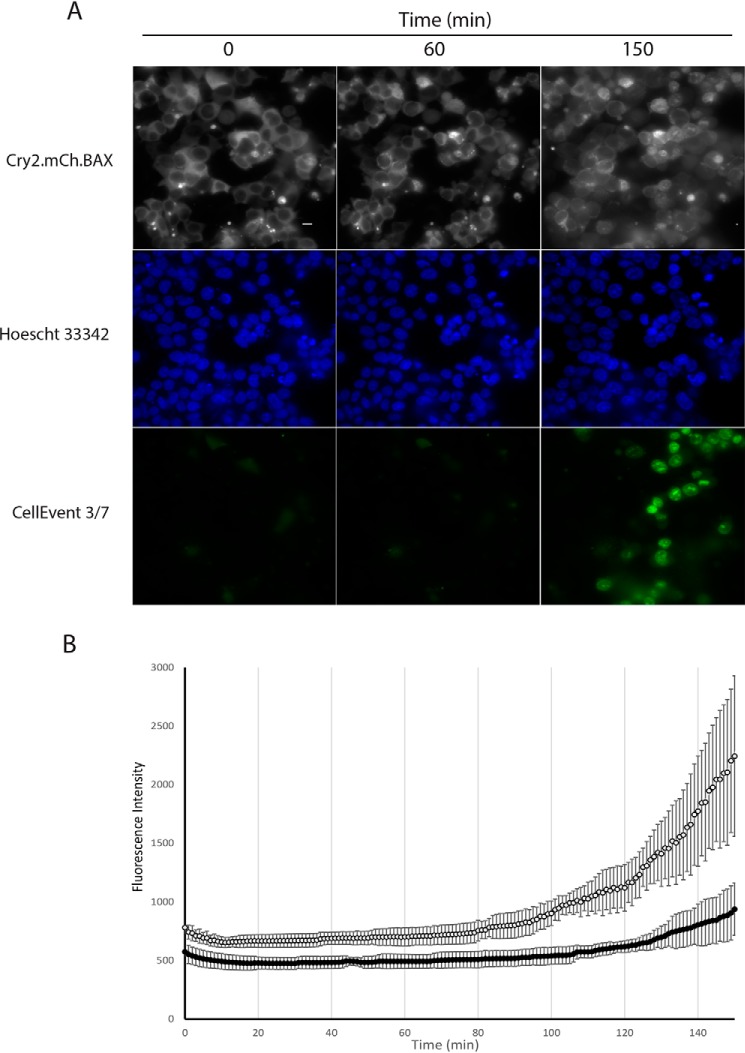
Three-color experiment. A, multicolor imaging (Leica DmI8 wide-field microscope equipped with an OKOLab stage-top incubator) of mitochondrial recruitment, chromatin condensation, and caspase cleavage in HEK293T cells. B, fluorescence intensity versus time for the caspase activity marker (CellEvent 3/7). Images were acquired every minute over a 2.5-h time course. Cells were either treated with 50 μm Z-VAD-fmk (dark circles) or left untreated (empty circles) for 50 min prior to the experiment. Error bars represent standard deviations from four replicate measurements. Scale bar = 10 μm.

