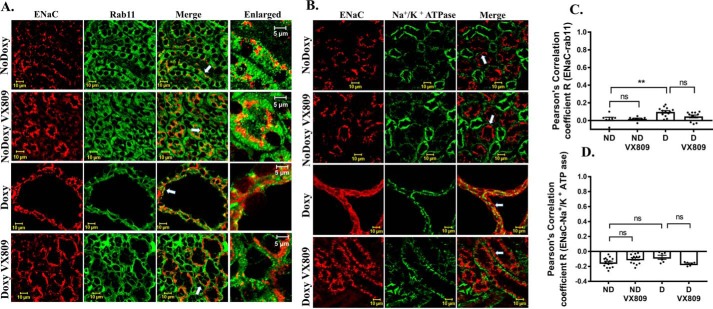
Figure 10.
A and C, lack of ENaC and Rab11 co-localization. Representative confocal images of normal pkd1+/+ (no doxycycline) or pkd1−/− mouse kidney treated with doxy to induce cyst formation and additionally treated with either DMSO or VX-809. A, figures depict sections stained for ENaC (red) or Rab11 (green) or the merged image (yellow) that denotes co-localization. Enlarged represents a portion of the merged panel enlarged at the arrow. Scale bar is 10 μm. C, summary of Pearson's correlation coefficient, R. Note: ENaC did not show significant co-localization with the endosomal marker in either control or VX-809–treated animals. B and D, lack of ENaC and Na+/K+-ATPase co-localization. B, figure depicts sections stained for ENaC (red) or Na+/K+-ATPase (green) or the merged image (yellow) that denotes co-localization. Scale bar is 10 μm. D, summary of Pearson's correlation coefficient, R. Note: ENaC did not show significant co-localization with the basolateral marker in either control or VX-809–treated animals. **, p < 0.01; ns, not significant.

