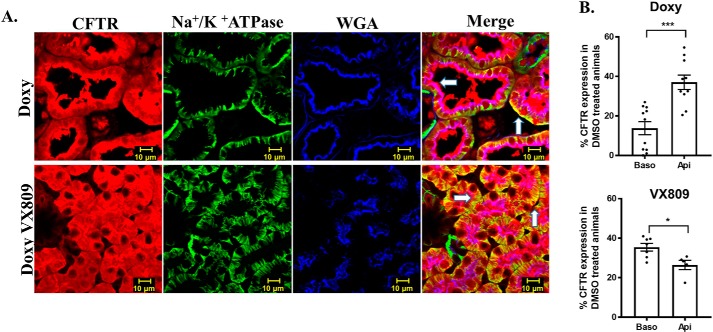
Figure 4.
CFTR and Na+/K+-ATPase and WGA co-localization. A, confocal laser-scanning triple-label immunofluorescence microscopy images of pkd1−/− mouse kidneys stained for CFTR (red), Na+/K+-ATPase, WGA (blue), and the merged image. Scale bar is 10 μm. Yellow denotes co-localization of CFTR with Na+/K+-ATPase, and purple denotes co-localization of CFTR with WGA. B, summary of the % co-localization with either Na+/K+-ATPase or WGA compared with the total CFTR staining. % CFTR was calculated by the total red fluorescence intensity compared with the green (Baso, basolateral) or blue (Api, apical). VX-809 treatment increased CFTR at the basolateral membrane. *, p < 0.05; ***, p < 0.001.

