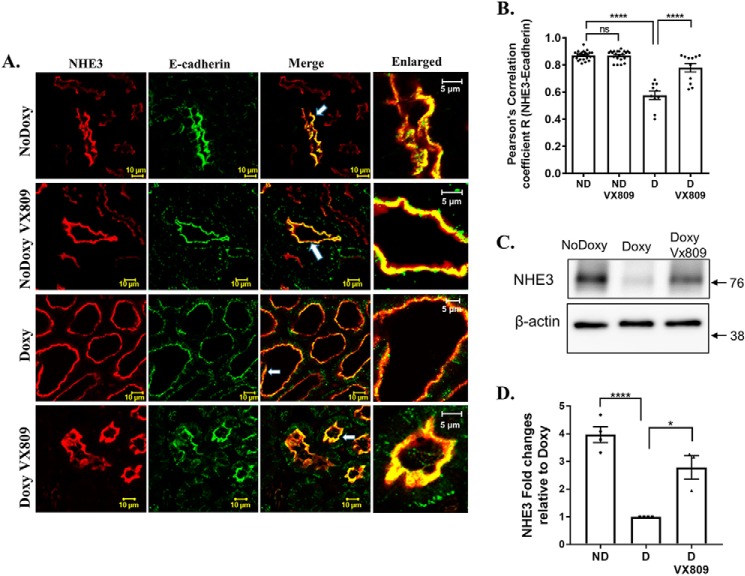
Figure 6.
A and B, NHE3 and E-cadherin co-localization. Representative confocal images of normal pkd1+/+ (no doxycycline) or pkd1−/− mouse kidney treated with doxy to induce cyst formation and additionally treated with either DMSO or VX-809. A, figure depicts sections stained for NHE3 (red), E-cadherin (green), or the merged image (yellow) that denotes co-localization. Scale bar is 10 μm. B, summary of Pearson's correlation coefficient, R. NHE3 co-localization with the membrane marker E-cadherin increased by about 50% following VX-809 treatment. C and D, NHE3 expression in pkd1+/+ (no doxycycline) and pkd1−/− (doxycycline) mice. C, Western blotting showing the expression of NHE3 in pkd1+/+ (no doxy) mice, pkd1−/− (doxy) mice, and pkd1−/− mice treated with VX-809 (doxy VX-809). D, columns represent averages ± S.E. of NHE3 expression. Data were analyzed by ANOVA followed by a multiple comparison test compared with doxycycline-treated animals. The experiment was repeated 3–4 times as depicted by the dots. *, p < 0.05; ****, p < 0.0001; ns, not significant. The NHE3 expression was higher in pkd1+/+ mice than in pkd1−/− mice. VX-809 treatment increased the NHE3 expression in pkd1−/− mice.

