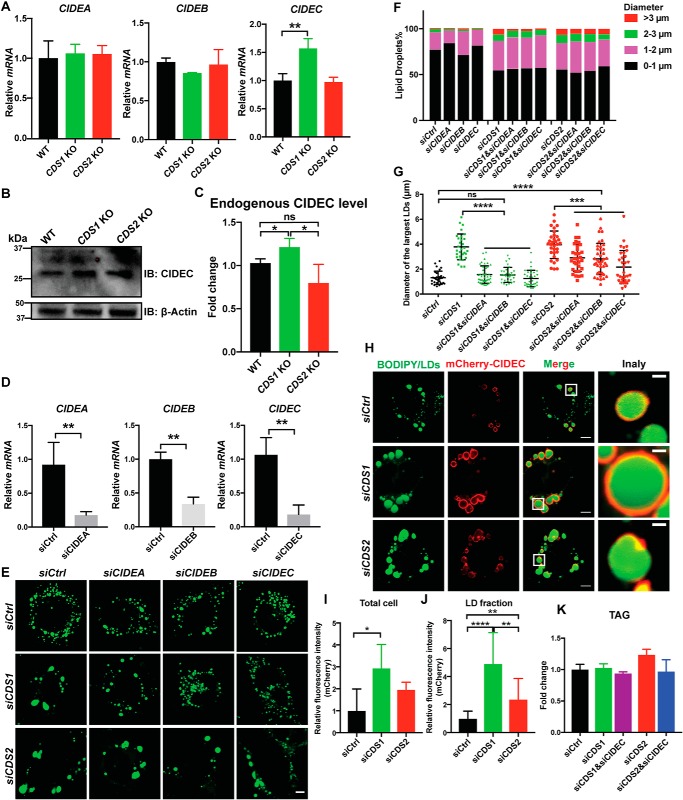
Figure 2.
Knocking down CIDEC reduced the occurrence of sLDs in CDS1-deficient cells. A, CDS1 KO increased the mRNA level of CIDEC in HeLa cells. Two-tailed Student's t test was used: mean ± S.D. (error bars); n = 3; **, p < 0.01. B, immunoblot analysis of endogenous CIDEC in HeLa cells upon CDS depletion. C, quantification of CIDEC level in B. Two-tailed Student's t test was used: mean ± S.D.; n = 3; *, p < 0.05; ns, no significance. D, the KD efficiency of CIDEA, -B, and -C in HeLa cells. Two-tailed Student's t test was used: mean ± S.D.; n = 3; **, p < 0.01. E, morphology of LDs upon CIDEA/B/C KD in CDS-deficient cells. 200 μm oleate was added to cells to induce LD formation for 16 h. LDs were stained by BODIPY. Two different siRNA sequences were used for each gene. Bars, 5 μm. F, distribution of LDs according to their sizes in E. LDs from ∼50 cells/cell type were used. G, quantification of the diameters of three largest LDs in each cell as shown in F. One-way analysis of variance was used: mean ± S.D.; n = 45 LDs from 15 cells for each cell type; **, p < 0.01; ***, p < 0.001; ****, p < 0.0001; ns, no significance. H, localization of CIDEC in CDS KD cells. Bars, 5 μm. Inset, bars, 1 μm. I, protein level of CIDEC upon CDS depletion in whole cell examined by fluorescence. Two-tailed Student's t test was used: mean ± S.D.; n = 20; *, p < 0.05. J, protein level of CIDEC upon CDS depletion in LD fraction examined by fluorescence. Two-tailed Student's t test was used: mean ± S.D.; n = 20; **, p < 0.01; ****, p < 0.0001. K, TAG levels when CIDEC was knocked down in CDS-deficient HeLa cells. Values are mean ± S.D.; n = 3. 200 μm oleate was added to cells to induce LD formation for 16 h.

