Figure 5.
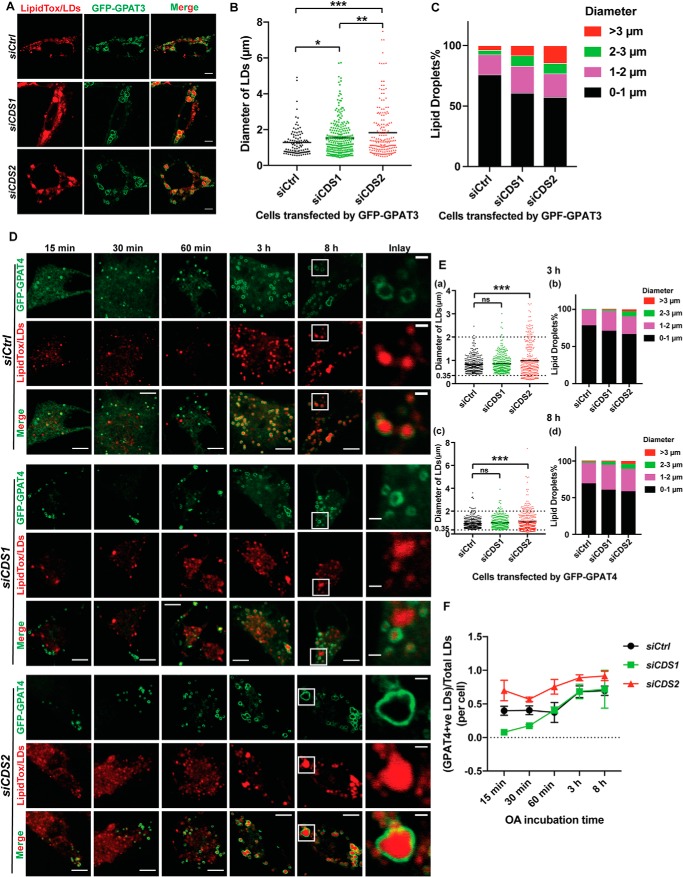
CDS2 deficiency promoted LD-association of GPAT4. A, localization of GPAT3 in CDS KD cells after incubation with 200 μm oleate for 16 h. Bars, 5 μm. B, quantification of LD sizes in cells transfected by GFP-GPAT3 upon CDS deficiency. Two-tailed Student's t test was used: mean, n = ∼200–300 LDs from ∼20 cells. *, p < 0.05; **, p < 0.01; ***, p < 0.001. C, distribution of LDs in cells transfected by GFP-GPAT3 upon CDS deficiency. LDs from ∼20 cells/cell type were used. D, localization of GPAT4 in CDS KD cells at the early stage of LD formation in CDS KD cells. 200 μm oleate was added to cells for the indicated time. Bars, 5 μm. Inset, bars, 1 μm. E, quantification of size (a and c) and distribution (b and d) of GPAT4-positive LDs at 3 and 8 h after adding oleate. Two-tailed Student's t test was used: mean; n = ∼200–350 LDs from ∼20 cells; ***, p < 0.001; ns, no significance. F, quantification of GPAT4-LD associations during LD growth upon CDS deficiency: mean ± S.E. (error bars); n = 20 cells. OA, oleate.

