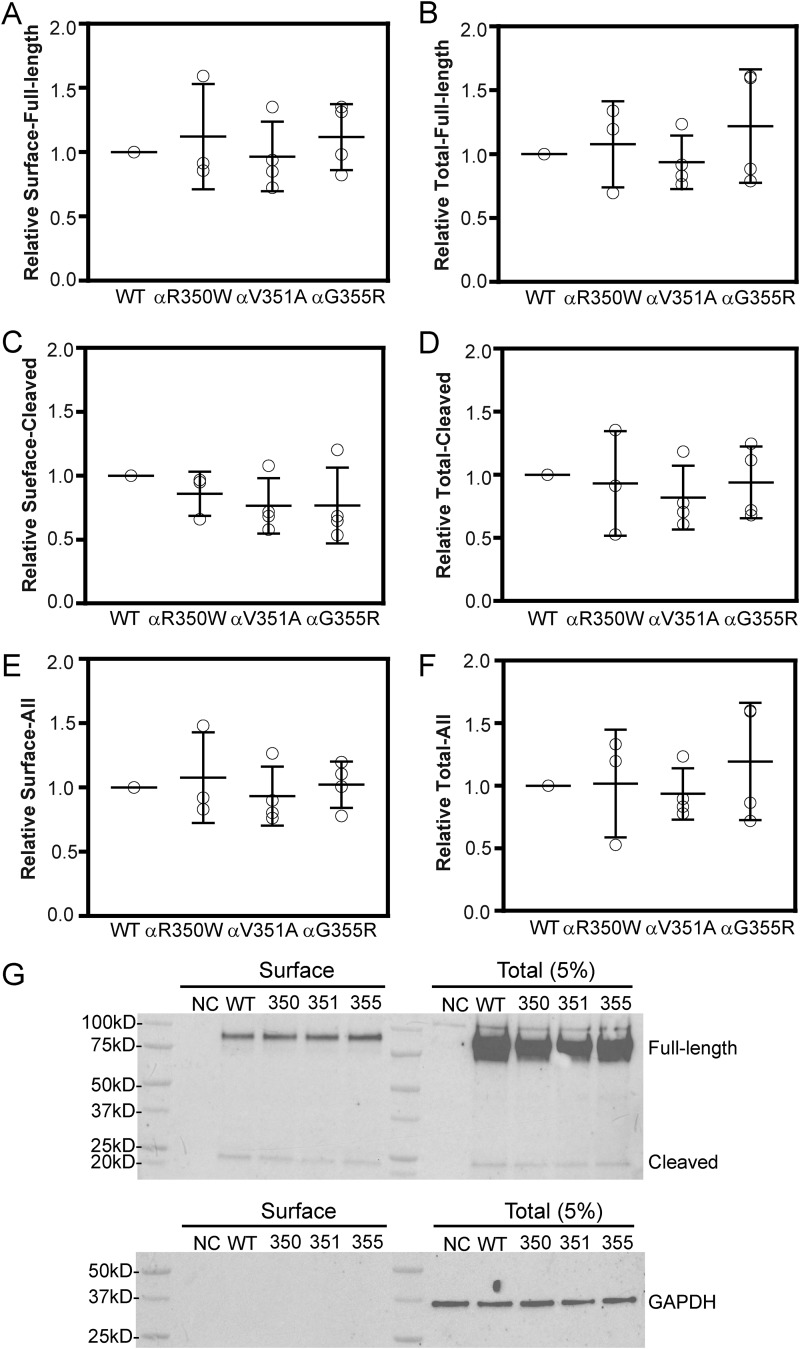
Figure 4.
Function variants do not alter ENaC surface expression in FRT cells. Cells were transfected with a WT or mutant (αR350W, αV351A, or αG355R) α-subunit with an N-terminal HA and C-terminal V5 epitope tag, together with nontagged WT β- and γ-subunits. Surface proteins were labeled with NHS-SS-biotin and following cell lysis were isolated with avidin beads. Following SDS-PAGE, proteins were immunoblotted with a horseradish peroxidase-conjugated anti-HA antibody. Chemiluminescence was quantified with Bio-Rad ChemiDocTM system and then normalized to GAPDH expression. Resultant values were normalized to WT to obtain the relative expression levels for each experiment. Relative αENaC surface expression levels are shown in A (full-length, 90 kDa), C (cleaved, 22 kDa), and E (full-length+ cleaved, 90 + 22 kDa). Relative total αENaC expression levels (5% of the cell lysate) are shown in B (full-length, 90 kDa), D (cleaved, 22 kDa), and F (full-length + cleaved, 90 kDa + 22 kDa). G, representative blots for surface and total (5% of the cell lysate) expression of αENaC. Negative control (NC) represents results with cells transfected with nontagged human α, β, and γ cDNAs. WT, 350, 351, and 355 represent the cells transfected with cDNAs for HA-α-V5, HA-αR350W-V5, HA-αV351A-V5, or HA-αG355R-V5, respectively, accompanied with nontagged β- and γENaCs. Bars are mean ± S.D. All values in A–F were not significantly different (p > 0.05, n = 3–4, one-way ANOVA).

