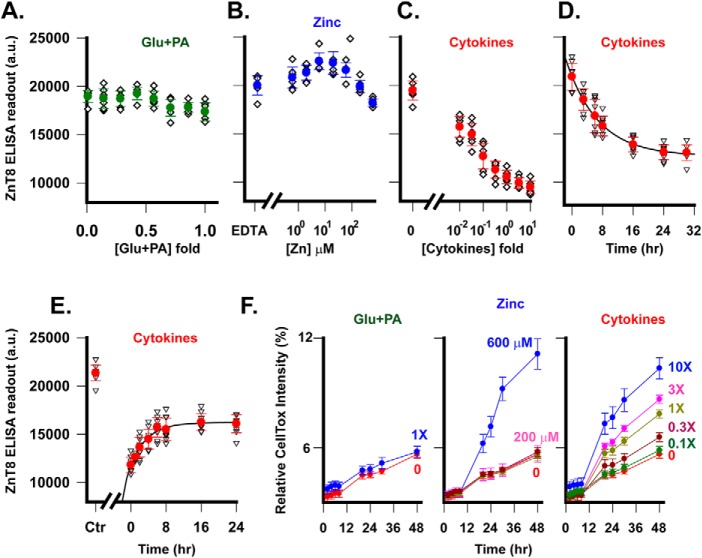
Figure 2.
Perturbation of endogenous ZnT8 expression. A–C, dose responses of the endogenous ZnT8 level as a function of Glc + PA (green), zinc (blue) or cytokine concentration (red). Filled circles, means of eight replicated measurements (diamonds) with S.D. values shown as error bars. D, time course of cytokine-induced ZnT8 down-regulation. Solid line, an exponential fit of the time course (r2 = 0.99). Error bars, S.D. of eight replicated measurements from one representative experiment. E, time course of ZnT8 recovery after removal of cytokines at t = 0. Ctr, untreated control. Solid line, exponential fit of the time course (r2 = 0.99). F, time courses of normalized CellTox fluorescence intensities in response to different concentrations of Glc + PA, zinc, and cytokine exposures as indicated. The relative CellTox fluorescence intensity was normalized to that induced by detergent-induced cell lysis. Filled circles, means of eight replicated measurements; error bars, S.D. a.u., arbitrary units.

