Figure 3.
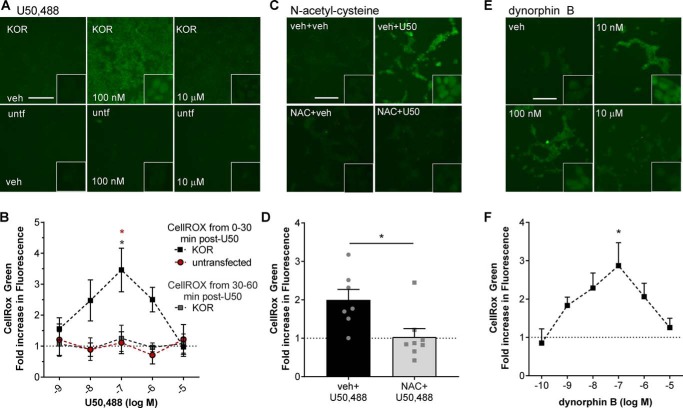
U50,488 and dynorphin B stimulate generation of reactive oxygen species. A and B, untransfected (untf) HEK293 cells or HEK293 cells stably expressing mycKOR were treated with CellROX Green and with the indicated concentration of U50,488 (U50) for 30 min or with the indicated concentration of U50,488 for 60 min with CellROX Green added for the last 30 min. Cells were fixed and imaged for CellROX Green fluorescence. Representative images (A) and quantification (B) are shown. Fluorescence was significantly increased in mycKOR HEK293 cells following 30 min of 100 nm U50,488 treatment (two-way ANOVA (significant effect of group, F2,42 = 9.749, p = 0.0003, n = 3–6; effect of concentration, F2,42 = 1.206, p = 0.3226; and interaction effect, F8,42 = 1.471, p = 0.1969) with Holm–Šidák post hoc against untransfected cells and later CellROX treatment (red *, p = 0.0246 and gray and red *, p = 0.0211). C and D, cells were pretreated with 10 μm NAC or vehicle (veh) for 30 min. Cells were then treated with CellROX Green and 100 nm U50,488 for 30 min. Cells were fixed and imaged for CellROX Green fluorescence. Representative images (C) and quantification (D) are shown. Pretreatment with NAC significantly blocked U50,488-stimulated CellROX Green fluorescence (Student's t test, p = 0.0151, n = 7–8). E and F, cells were treated as for A but with the indicated concentration of dynorphin B. Fluorescence was significantly increased in mycKOR HEK293 cells following 30-min 100 nm dynorphin B treatment. Representative images (E) and quantification (F) are shown (one-way ANOVA (F5,42 = 2.514, p = 0.0444, n = 4–10) with Holm–Šidák post hoc comparison against 0.1 nm (*, p = 0.0149)). Scale bars represents 200 μm (50 μm for inset); graphs depict mean ± S.E. with individual replicates shown.

