
Figure 2.
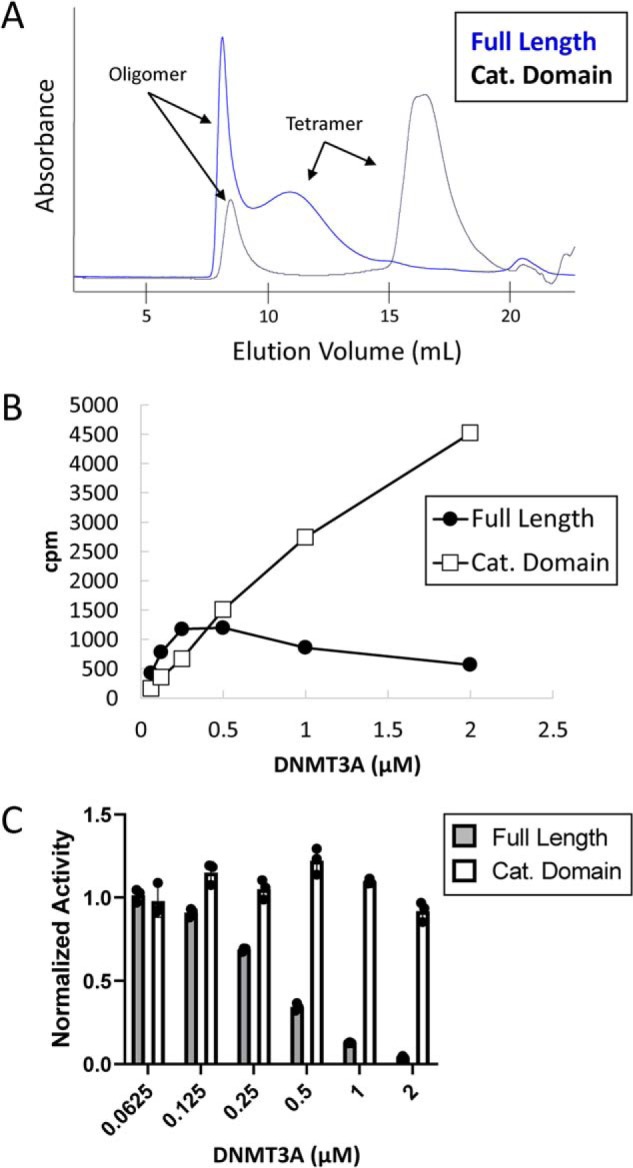
Comparison of full-length and catalytic domain oligomeric state and activity. A, chromatogram of purified full-length and catalytic domain DNMT3A injected onto a Superose 6 size-exclusion column. 500 μg of each protein was injected. B, total activity of DNMT3A full-length and catalytic domain proteins at the indicated concentrations measured using a radioactive end-point assay. C, specific activity of full-length and catalytic domain proteins at the indicated concentrations. Specific activity at the lowest DNMT3A concentration was normalized to one for full-length and catalytic domains, respectively. Error bars represent S.D., n = 3.