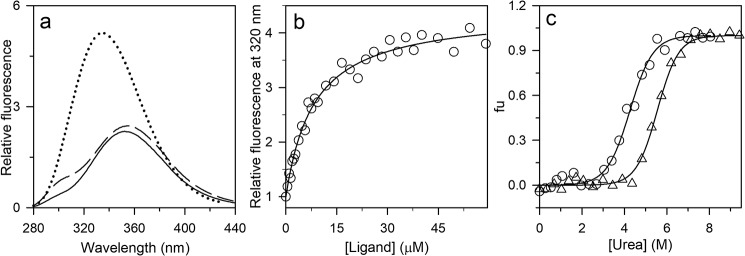
Figure 2.
Characterization of the PI3K SH3 domain in the absence and presence of the ligand. a, fluorescence emission spectra of N (solid black line), U (dashed black line), and ligand-bound N (dotted line) upon excitation at 268 nm. b, the binding curve was obtained by measuring the change in the intrinsic Trp fluorescence signal at 320 nm upon excitation at 268 nm. The data were obtained by equilibrating 0.3 μm protein with the indicated ligand concentrations. The raw data were normalized to values of 1 for the fluorescence signals of the completely unbound state of the protein. The solid line through the points is a fit to Equation 1. A value of 7 μm was obtained for KDN. c, equilibrium unfolding curves in the absence (○) and presence (▵) of the ligand (350 μm) were determined by monitoring the fluorescence at 300 and 320 nm, respectively, upon excitation at 268 nm. The data were converted to fraction unfolded (fu) values and plotted against the concentration of urea. The solid lines through the data are fits to a two-state model of unfolding.

