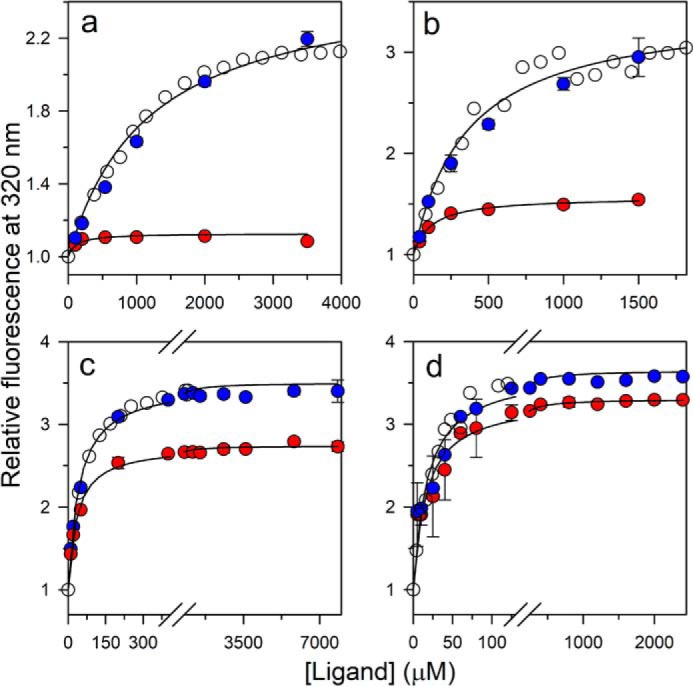
Figure 5.

Comparison of the kinetic amplitudes with the equilibrium amplitudes of folding in 6 (a), 5 (b), 3.5 (c), and 2.8 m urea (d). Open circles, equilibrium binding curve; red filled circles, the t = 0 points; and blue filled circles, the t = ∞ points of the kinetic traces of folding induced by ligand binding. For each urea concentration, the data have been normalized to a value of 1 for the protein fluorescence signal in the absence of ligand. The solid lines through the t = 0 points (red filled circles) are fits to Equation 1. The error bars, showing the spread in the data, were obtained from two or more independent experiments.
