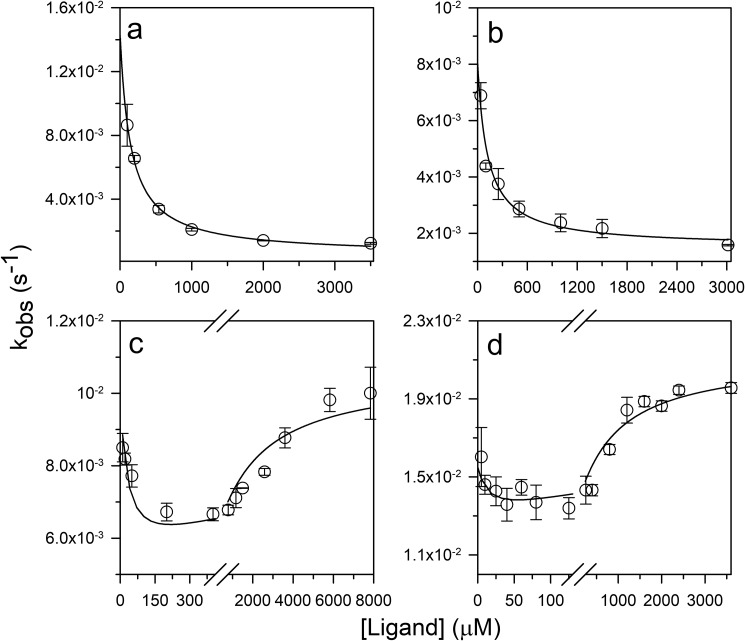
Figure 7.
Dependence of the observed rate constants of ligand-induced folding on ligand concentration. Dependence of the observed rate constants of ligand-induced folding were determined in 6 (a), 5 (b), 3.5 (c), and 2.8 m (d) urea. The solid lines through the data in a and b are fits to Equation 3, and the solid lines through the data in c and d are fits to Equation 4. The values of KDN were fixed to the values obtained from the t = 0 points of ligand-induced folding traces, and the values of KDU were fixed to the values obtained from equilibrium binding curves. The parameters obtained from fitting the data are listed in Table 1. The error bars, showing the spread in the data, were obtained from two or more independent experiments.

