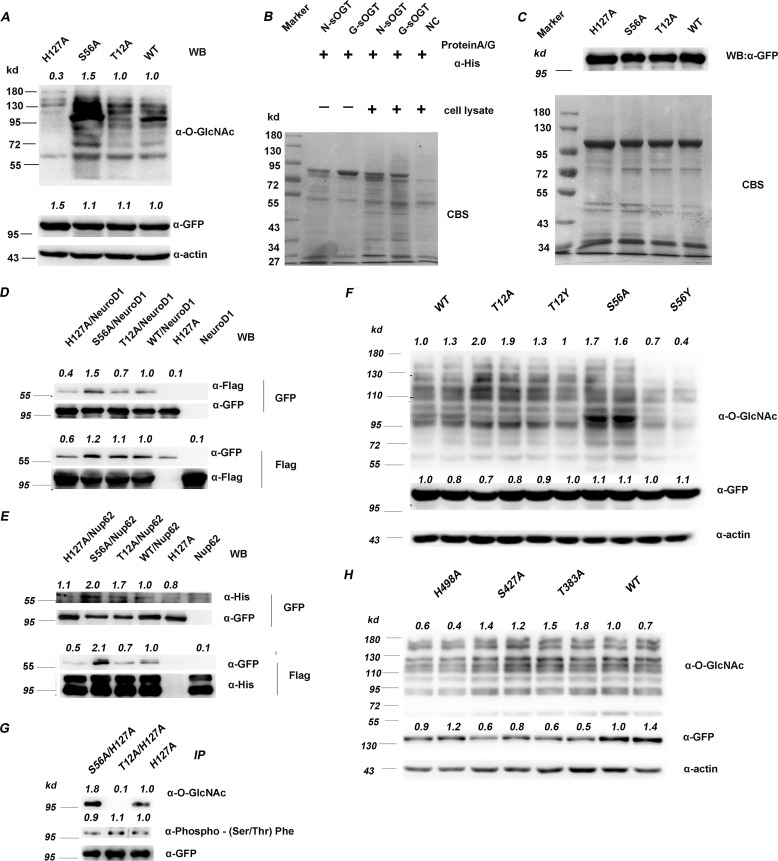
Figure 3.
O-GlcNAcylation modulates sOGT substrate selectivity. A, the indicated sOGT mutants were expressed in HEK293T cells, and total protein O-GlcNAcylation was examined via Western blotting. B, O-GlcNAc sOGT and naked sOGT were applied to pull down proteins from HEK293T cell lysates. The interaction proteins were examined via SDS-PAGE visualized with Coomassie Brilliant Blue staining (CBS). C, the indicated sOGT mutants were expressed in HEK293T cells. Their interaction proteins were visualized by Coomassie Brilliant Blue staining (bottom). sOGT mutants were measured via Western blotting (top). D and E, His-tagged Nup62 (D) and FLAG-tagged NeuroD1 (E) were co-expressed with GFP-tagged sOGT, respectively, and their interaction with sOGT was evaluated via co-immunoprecipitation and Western blotting. F, gain-of-function mutation. Thr12/Ser56 were mutated to tyrosine to mimic O-GlcNAcylation, and their influence was assessed in HEK293T cells via Western blotting. G, examination of sOGT phosphorylation. The indicated sOGT mutants were expressed in HEK293T cells. O-GlcNAcylation and phosphorylation of these mutants were measured. H, influence on ncOGT. The indicated ncOGT mutants (1036 aa) were expressed in HEK293T cells, and O-GlcNAcylation of total proteins was measured via Western blotting. Western blots were quantified with ImageJ for each blot, the O-GlcNAcylation of target mutants or the amount/abundancy of target proteins was normalized to the input (α-actin in A, F, and H; α-FLAG in D and E; α-GFP in D, E, F, and G; α-His in E).

