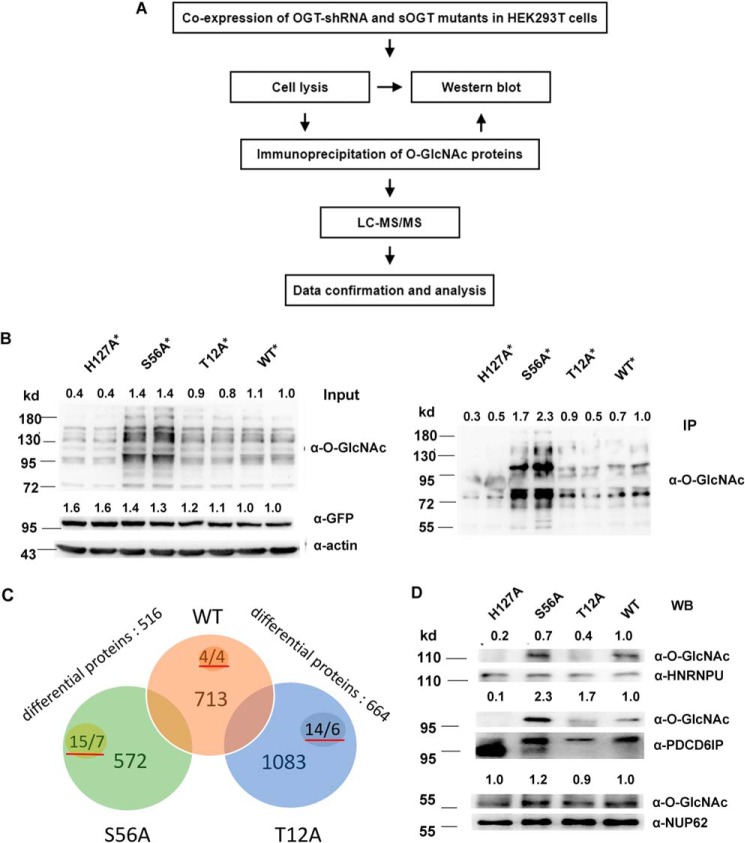
Figure 4.
T12A and S56A glycosylate different proteins/peptides in HEK293T cells. A, work flow of the proteomic study. B, *, confirmation of the pooled O-GlcNAc proteins for proteomic analysis. OGT-shRNA2 and indicated shRNA-resistant sOGT mutants were co-expressed in HEK293T cells in duplicate. O-GlcNAcylation of total proteins (Input) or immunoprecipitated proteins (IP) was examined via Western blotting. C, *, raw files from the MS analysis were searched by MaxQuant and processed using an intensity-based absolute quantification (iBAQ) approach. 713, 1083, and 572 proteins were found in WT, T12A, and S56A samples (Sheet S2), respectively. After normalization and blank subtraction, 516 and 664 differential proteins were obtained in two comparison samples (iBAQ ratio ≥ 1.5) (Sheets S3 and S4); the numbers with red underlines indicate confirmed O-GlcNAc peptides/proteins in each sample (Sheet S5). D, the indicated sOGT mutants were expressed in HEK293T cells. Selected proteins were immunoprecipitated from each sample, and their O-GlcNAcylation was measured via Western blotting (WB). *, using OGT-shRNA resistant mutants (Fig. S8). Western blots were quantified with ImageJ for each blot, and the O-GlcNAcylation of target mutants or amount/abundancy of target proteins was normalized to the input.

