FIG 4.
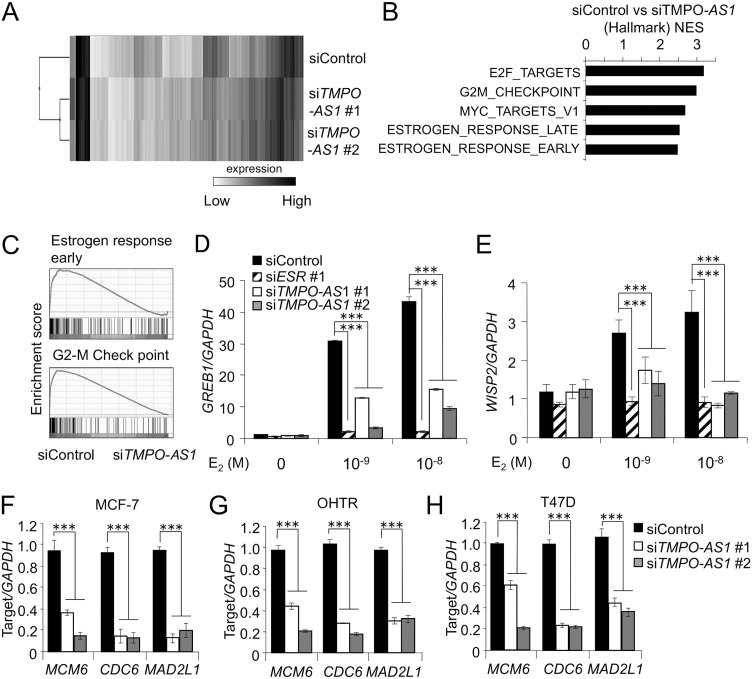
TMPO-AS1 knockdown represses estrogen signaling and proliferation-related gene expression. (A) Clustering microarray results of MCF-7 cells treated with control or TMPO-AS1-specific siRNAs. (B) Top 5 pathways enriched in genes downregulated by siTMPO-AS1 versus siControl determined by gene set enrichment analysis (GSEA). (C) GSEA enrichment plots for dominant pathways in MCF-7 cells treated with siTMPO-AS1, including estrogen response early and the G2-M checkpoint. (D and E) Effects of TMPO-AS1 knockdown on GREB1 (D) and WISP2 (E) levels in MCF-7 cells. Data are normalized to GAPDH levels and presented as mean fold changes ± SD versus levels for siControl in the absence of E2 (n = 3). (F to H) Effects of TMPO-AS1 knockdown on MCM6, CDC6, and MAD2L1 levels in MCF-7 (F), OHTR (G), and T47D (H) cells. Relative RNA levels are presented as mean fold changes ± SD versus levels for siControl (n = 3). *, P < 0.05; **, P < 0.01; ***, P < 0.001; ns, not significant.

