FIG 6.
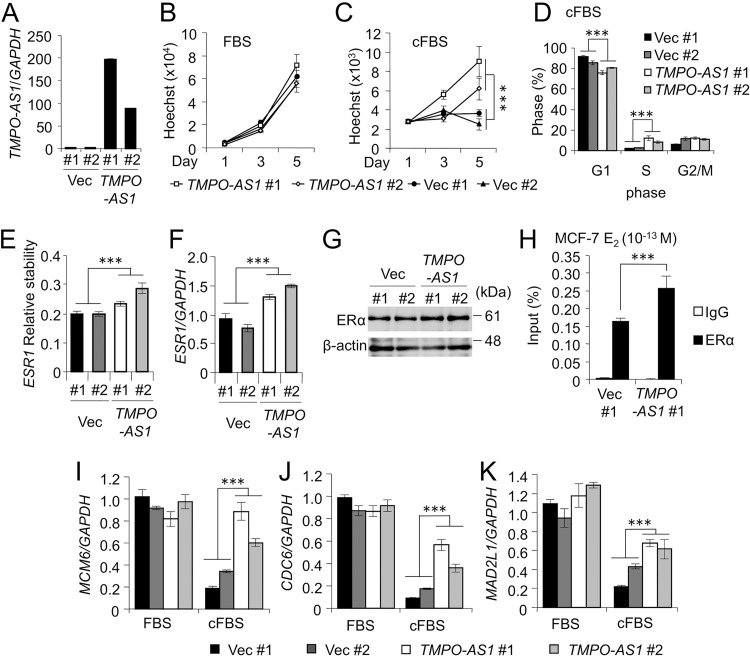
TMPO-AS1 overexpression promotes breast cancer cell proliferation. (A) The RNA expression of TMPO-AS1 in cells stably overexpressing TMPO-AS1 and control cells. Data were normalized to GAPDH and are presented as mean fold changes ± SD versus levels for Vec #1 (n = 3). (B and C) Cell growth of MCF-7 cells stably overexpressing TMPO-AS1 and cultured with normal FBS (B) or charcoal-stripped FBS (cFBS) (C) was measured by DNA assay. Data are presented as means ± SD (n = 5). (D) Cell cycle analyses with propidium iodide (PI) in MCF-7 cells stably overexpressing TMPO-AS1 and cultured with cFBS were performed by flow cytometry (n = 3). (E) mRNA stability of ESR1 in the MCF-7 cells stably overexpressing TMPO-AS1 were measured by qRT-PCR. Cells were treated with ActD and collected after 0 and 6 h. Data were normalized to GAPDH and presented as mean fold changes ± SD versus the values at 0 h. (F) The expression levels of ESR1 mRNA in MCF-7 cells stably overexpressing TMPO-AS1 were measured by qRT-PCR. Data were normalized to GAPDH and are presented as mean fold changes ± SD versus levels for Vec #1 (n = 3). (G) ERα protein expression in MCF-7 cells stably overexpressing TMPO-AS1 were measured by Western blotting. β-Actin protein was used as a loading control. (H) ERα occupancy on the GREB1 ERE enhancer region in control and TMPO-AS1-overexpressing MCF7 cells after E2 (10−13 M) treatment for 45 min, analyzed by ChIP assay. Data were normalized by input DNA and are presented as means ± SD (n = 3). (I to K) MCM6 (I), CDC6 (J), and MAD2L1 (K) mRNA levels in MCF-7 cells stably overexpressing TMPO-AS1 cultured for 48 h in medium containing normal FBS or cFBS. Data are presented as mean fold changes ± SD versus values of vector-transfected MCF-7 cells (Vec #1) cultured in FBS (n = 3). *, P < 0.05; **, P < 0.01; ***, P < 0.001; ns, not significant.

