FIG 8.
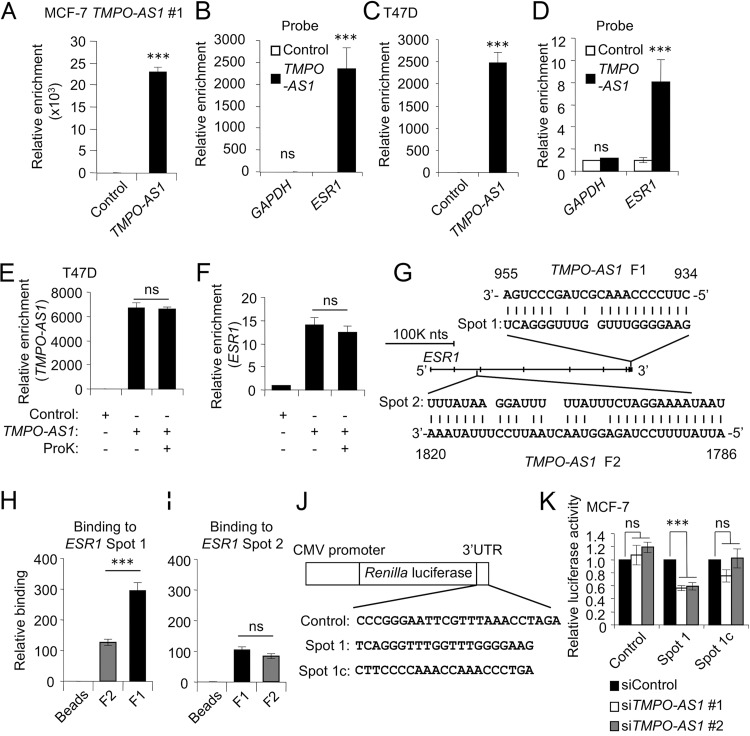
TMPO-AS1 stabilizes ESR1 mRNA through direct RNA-RNA interaction at the ESR1 3′-UTR. (A and C) In vivo binding of TMPO-AS1 and ESR1 in living cells, analyzed by the RNA antisense purification method. TMPO-AS1 levels were determined by qRT-PCR in RNA samples precipitated with the indicated probes from lysates of MCF-7 cells stably overexpressing TMPO-AS1 #1 (A) and T47D (C) cells. (B and D) ESR1 and GAPDH levels in RNA samples precipitated with the indicated probes from MCF-7 cells stably overexpressing TMPO-AS1 #1 (B) and T47D cells (D). Data are presented as mean fold changes ± SD versus levels for the control probe (n = 3). (E and F) In vivo binding of TMPO-AS1 and ESR1 in T47D cells treated with proteinase K (ProK) or left untreated, analyzed by the RNA antisense purification method. TMPO-AS1 (E) and ESR1 (F) levels in RNA samples were precipitated with the indicated probes and analyzed by qRT-PCR. Data are presented as mean fold changes ± SD versus levels for the control probe (n = 3). (G) Schematic representation of the predicted RNA-RNA interaction spots between TMPO-AS1 and ESR1. ESR1 Spot 1 and ESR1 Spot 2 were predicted to interact with nucleotides 934 to 955 (TMPO-AS1 F1) and 1786 to 1820 (TMPO-AS1 F2), respectively, of TMPO-AS1 RNA. (H and I) Direct interaction between ESR1 and TMPO-AS1 RNA was analyzed by an in vitro binding assay. Levels of synthesized RNAs for ESR1 Spot 1 (H) and ESR1 Spot 2 (I) coprecipitated with TMPO-AS1 F1 or F2 RNAs were evaluated by qRT-PCR. Data are presented as mean fold changes ± SD versus levels for control beads (n = 3). (J) Schematic representation of luciferase reporter vectors. Indicated sequences were inserted into psiCHECK2 plasmid. ESR1 Spot 1 complementary (Spot 1c) sequence is complementary to ESR1 Spot 1 sequence. (K) Luciferase activity of ESR1 Spot1 reporter in MCF-7 cells treated with the indicated siRNAs. Luciferase assay was performed using cells harvested 48 h after siRNA transfection. Renilla luciferase values were normalized to Firefly luciferase values. Data are presented as mean fold changes ± SD versus values in siControl-treated cells for each reporter gene. *, P < 0.05; **, P < 0.01; ***, P < 0.001; ns, not significant.

