Figure 4.
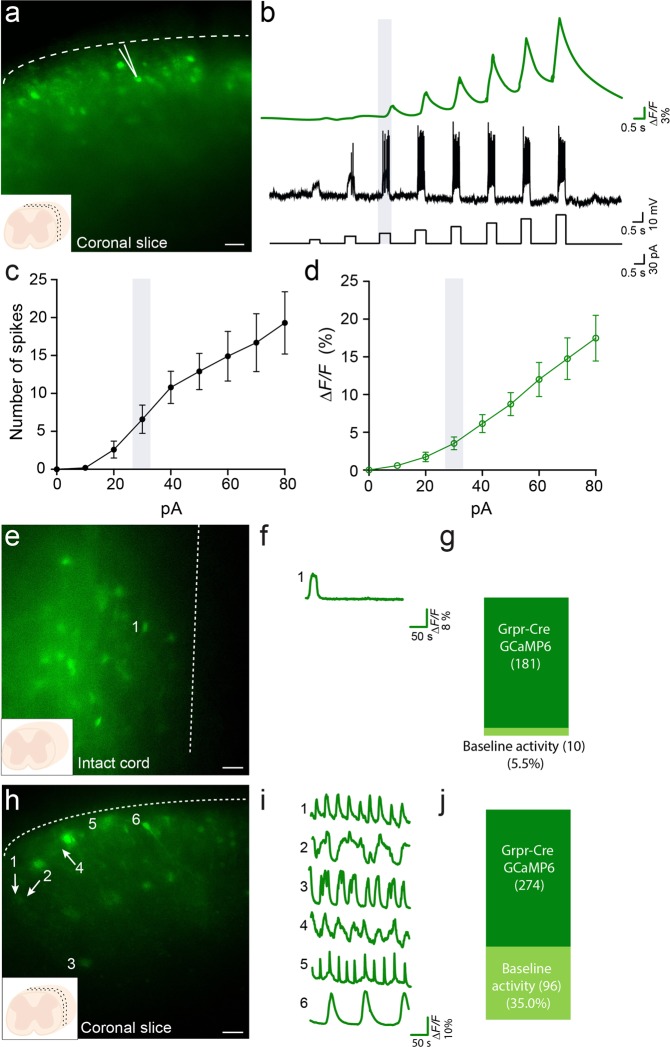
Correlation of induced action potentials and GCaMP6 fluorescence increase based on current injection in whole cell patch clamped neurons. (a) Coronal lumbar spinal cord 300 µM slice with Grpr-Cre neurons expressing GCaMP6 from an AAV9-CAG-DIO-GCaMP6 virally injected mouse. Arrow indicates a whole cell patch clamped neuron. Scale bar in A corresponds to 50 µm. (b) Fluorescence change and voltage traces from a whole cell patch clamped neuron where a sequence of stepped pulses from 10 pA – 80pA (8 pulses, 10 pA increment, 500 ms pulse duration and 1000 ms pulse interval) was applied. (c) Mean number of action potentials (spikes) induced by 8 steps 10 pA increment protocol. (d) Mean values for fluorescence increase (∆F/F) induced when recorded neurons were given 10 pA increment protocol in 8 steps. The data is presented as mean ± standard error (n = 10 neurons). The Grpr-Cre population shows basal spontaneous activity in in vitro preparations. Example traces from representative samples are shown. (e) Grpr-Cre neurons expressing GCaMP6 in an intact spinal cord. Number 1 indicates a neuron showing basal activity under control conditions. (f) Fluorescence change trace from the intact spinal cord neuron indicated in (e–g) Proportion of Grpr-Cre neurons expressing GCaMP6 in the intact spinal cord that showed basal activity. (h) 300 µM coronal slice with Grpr-Cre neurons expressing GCaMP6. Numbers 1–6 indicate six different neurons showing basal activity under control conditions. Numbers 1 and 2 indicate two different neurons that were not active on that specific frame and thus show a low level of fluorescence. (i) Fluorescence change traces from the neurons indicated by 1–6 in (h–j) Proportion of Grpr-Cre neurons expressing GCaMP6 that showed basal activity in coronal slices. Scale bar in (E, H) corresponds to 40 µm.

