Figure 5.
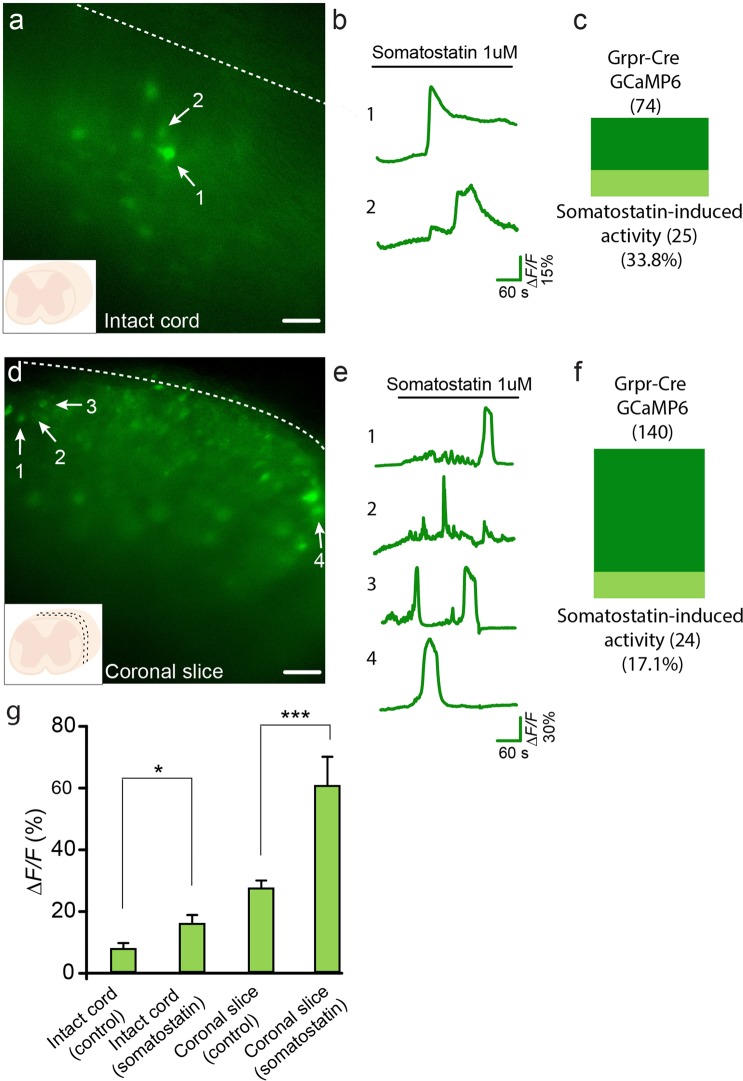
Grpr-Cre neurons expressing GCaMP6 are activated by somatostatin through disinhibition. Example traces from representative samples are shown. (a) Grpr-Cre neurons expressing GCaMP6 in an intact spinal cord. Numbers 1 and 2 indicate two neurons showing somatostatin-induced activity. (b) Fluorescence change traces from the intact spinal cord neurons indicated in a. (c) Proportion of Grpr-Cre neurons in the non-spontaneously active population expressing GCaMP6 in intact spinal cord that showed somatostatin-induced activity. (d) 300 µM coronal slice with Grpr-Cre neurons expressing GCaMP6. Numbers 1–4 indicate four different neurons showing somatostatin-induced activity. (e) Fluorescence change traces from the neurons indicated by 1–4 in (d–f) Proportion of Grpr-Cre neurons in the non-spontaneously active population expressing GCaMP6 in coronal slices that showed somatostatin-induced activity. (g) Mean values for fluorescence change (ΔF/F%) in GCaMP6 intensity for the intact cord and coronal slices, imaged at control conditions and when somatostatin was bath applied. Scale bar corresponds to 40 µm. The data is presented as mean ± standard error.

