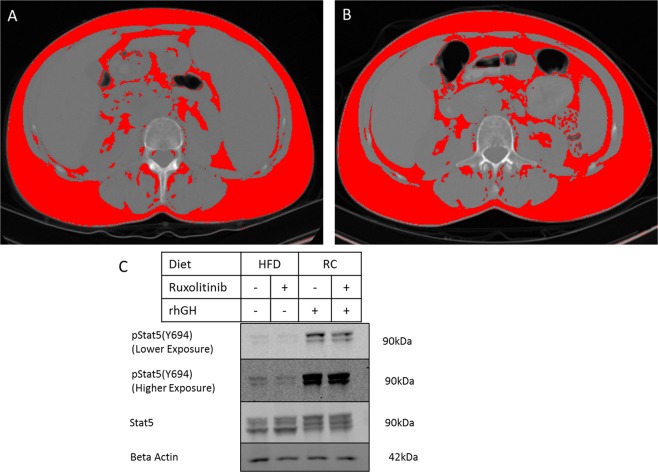
Figure 3.
Changes in adipose tissue mass and signaling after ruxolitinib treatment. Abdominal CT images at lumbar vertebra L3 level before (A) and after (B) treatment with ruxolitinib in a patient with 4.1 kg (6.5%) body weight gain. Red coloration indicates adipose tissue. (C) Western blot analysis of STAT5 phosphorylation in gonadal adipose tissue from C57BL/6J mice fed high fat diet (HFD), or regular chow (RC), and acutely treated with ruxolitinib, rhGH or vehicle, as indicated.

