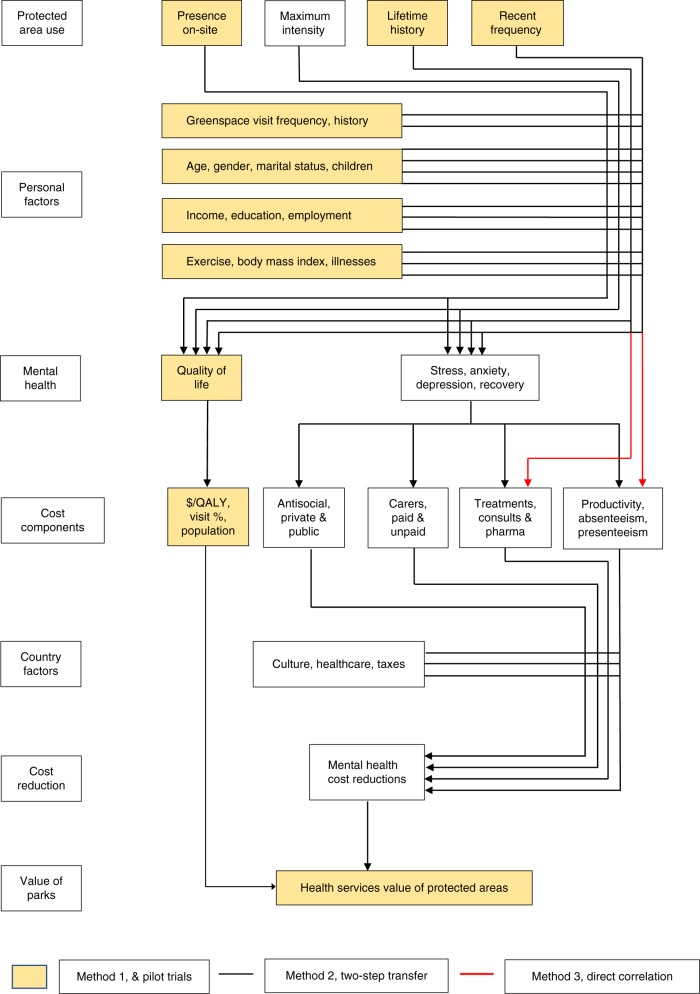
Fig. 1.
Flowchart of calculation pathways for health services value of protected areas. Seven-block flowchart of calculation pathways for health services value of protected areas, showing three major pathways. History, frequency, and intensity of protected-area visitation (block 1) affects mental health and quality of life of park visitors (block 3), but these are also affected by demographic and socioeconomic factors, physical health factors, and non-park greenspace use (block 2), which must therefore be controlled for. Costs (block 4) can be linked to mental health either via quality-adjusted life years (yellow boxes), individual cost components (black lines), or direct correlation with park visit patterns (red lines). Cost reductions (block 6) also depend on national healthcare funding systems (block 5). The health services value of protected areas (block 7) is the net reduction in aggregate costs of poor mental health, derived from visitation to protected areas. The three pilot studies presented here use the $/QALY pathway, shown in yellow boxes, with three different measures of park use (block 1)

