Figure 7.

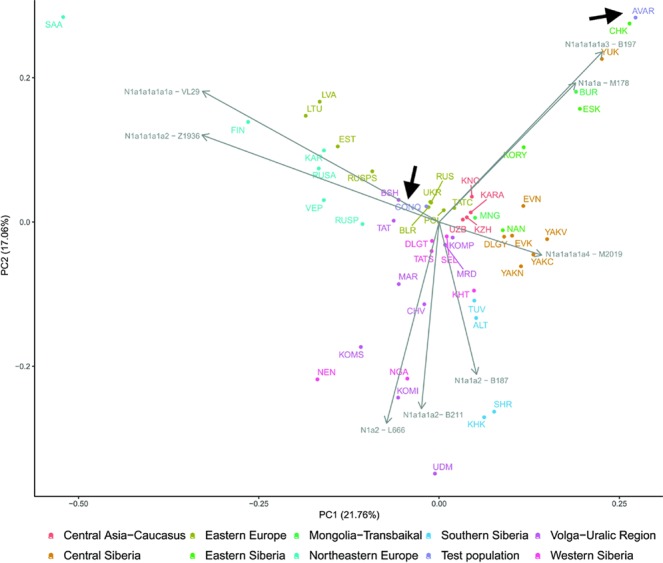
First two components of PCA from Hg N1a subbranch distribution in 51 populations including Avars and Conquerors (arrows). Colors indicate geographic regions. Three letter codes are given in Supplementary Table S5.

First two components of PCA from Hg N1a subbranch distribution in 51 populations including Avars and Conquerors (arrows). Colors indicate geographic regions. Three letter codes are given in Supplementary Table S5.