
Fig. 3.
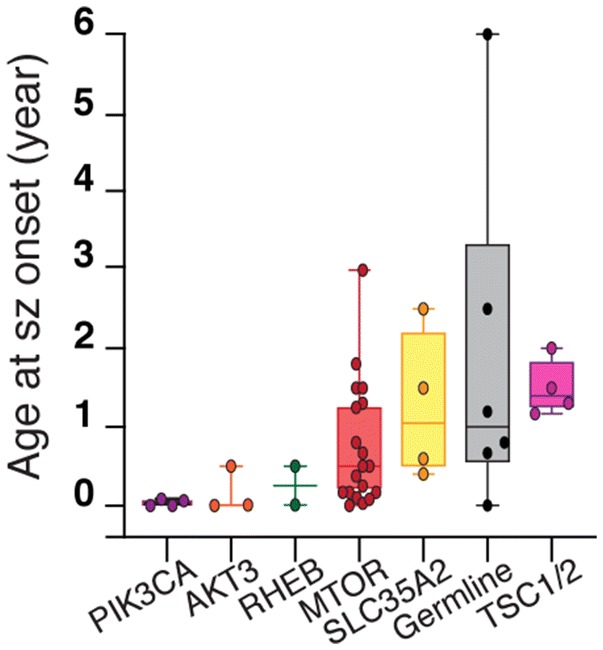
Genotype–phenotype correlations. Comparison of age at seizure (sz) onset between groups of patients with variants in different genes, reported as boxplots with minimum, maximum, average, and standard deviation (Kruskal–Wallis test with multiple comparisons). Germline group includes five DEPDC5 germline cases and one TSC2 germline case. TSC1/2 group includes only somatic variants