Fig. 8.
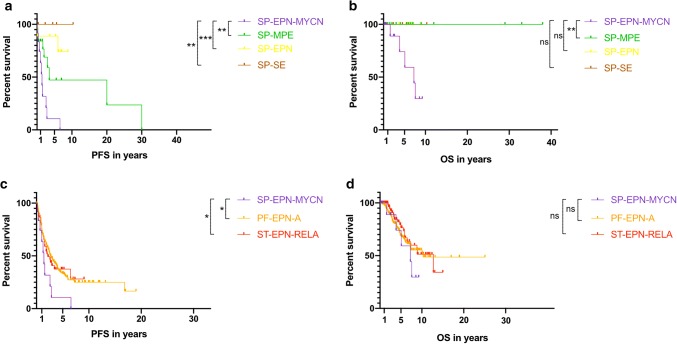
PFS and OS of SP-EPN-MYCN (n = 12) analyzed using Kaplan–Meier curves. a PFS and b OS of SP-EPN-MYCN were compared with all other molecular spinal ependymal subgroups as well as c, d ST-EPN-RELA and PF-EPN-A. P values were calculated using log-rank-tests between the molecular subgroups. ns = p > 0.05, * = p < 0.05, ** = p ≤ 0.01, *** = p ≤ 0.001. No survival data was available for patient 13. (Pajtler et al. 2015; Kraetzig et al. 2018)

