Figure 5.
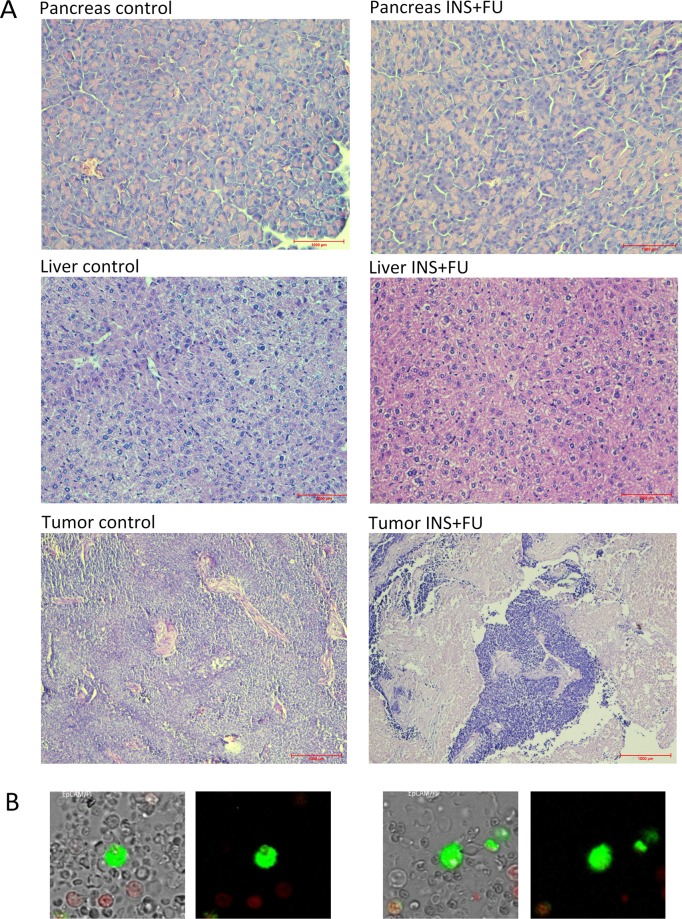
(A) Photographs of pancreas, liver, and tumor sections stained with hematoxylin-eosin (HE) to evaluate the impact of the insulin and chemotherapeutics on the tissues. The figure presents an organ from a control mouse and mouse treated with insulin and FU together (group 5). There are no significant changes in the morphology in the pancreas and liver. The figure of the tumor presents control, insulin, fluorouracil, and insulin together with fluorouracil (group 5) conditions. Sections of fluorouracil and fluorouracil with insulin reveals parts of the necrotic area in comparison to the control. Optical magnification: 200x (pancreas, liver) and 100x (tumor). (B) Illustrative images of CTCs detected in mouse blood. CTCs with a green EpCAM surface staining, a well-preserved morphology, but no red nuclear staining by PI is shown. The figure presents an image from a control mouse and mouse treated with insulin and FU together.

