FIGURE 1.

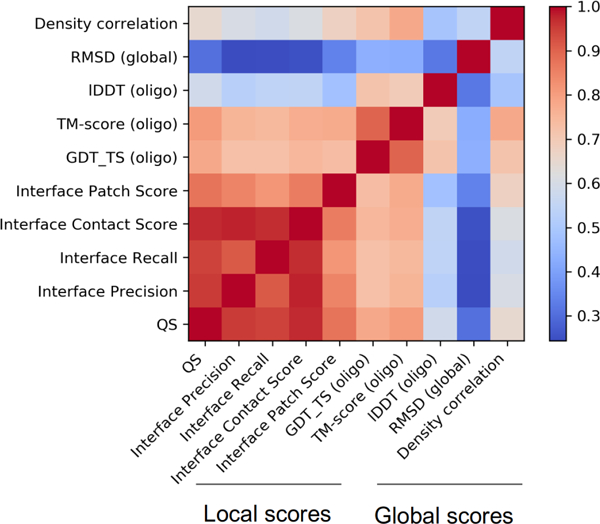
Score correlations. A heat map with correlations among all relevant scores used in the predictioncenter.org web site. The “local” block of scores captures interface features, the “global” block captures features of the whole assembly.

Score correlations. A heat map with correlations among all relevant scores used in the predictioncenter.org web site. The “local” block of scores captures interface features, the “global” block captures features of the whole assembly.