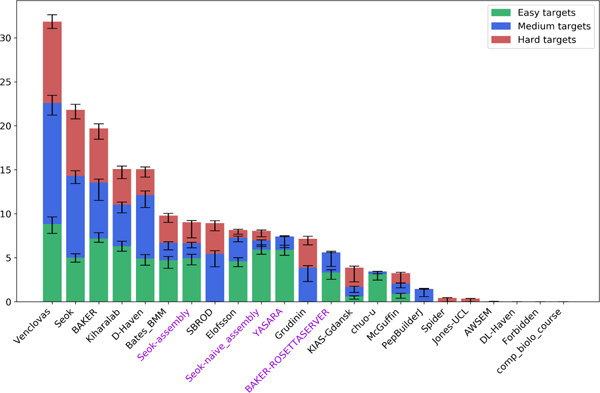
FIGURE 4.

Group rankings in the assembly category. The groups are sorted by the sum of Z -scores for all difficulty classes. The error bars are obtained by iteratively excluding every target from each difficulty class and recalculating the cumulative Z -scores. The server groups are labeled in violet.
