
Figure 3.
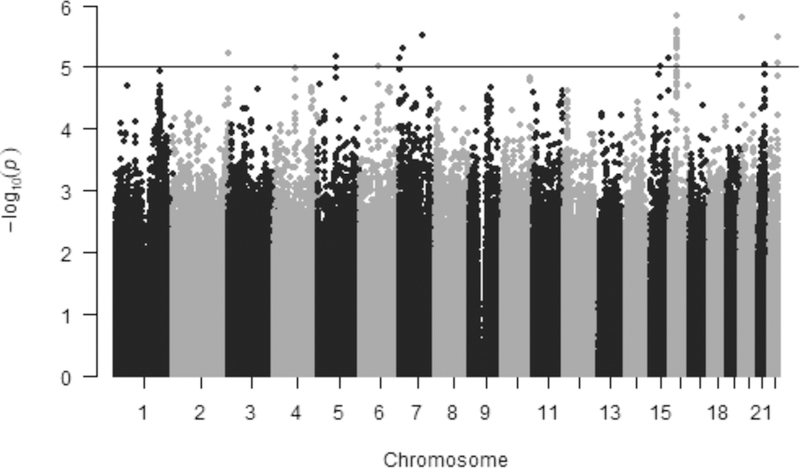
Manhattan plot for GWAS of FVC in the placebo treatment arm of CAMP. Results are plotted as minus log-transformed P-values from the genotype association FVC model controlled for age, sex and clinic site. Even numbered chromosomes are in grey and odd numbered chromosomes in black. The black line delineates SNPs that exceed the genome-wide significance threshold of 1.0E-05.