
Figure 4.
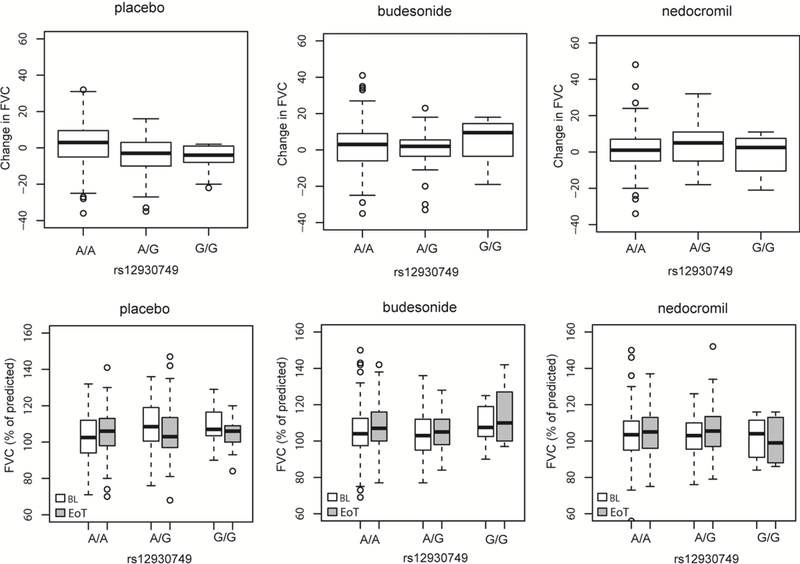
Change in FVC (% of predicted) stratified by rs12930749 (KIAA0556) genotype in the three CAMP treatment arms A) placebo; B) budesonide; and C) nedocromil treatment arms. Baseline (BL) and end of treatment (EoT) FVC stratified by rs12930749 KIAA0556 genotype in the D) placebo; E) budesonide; and F) nedocromil treatment arms. The mean is denoted by the dark black lines bisecting the boxes which represent the standard deviations; the range is indicated by the dashed lines with outliers as the circles. Box plots denote the median (dark line) and interquartile ranges, circles represent outliers.