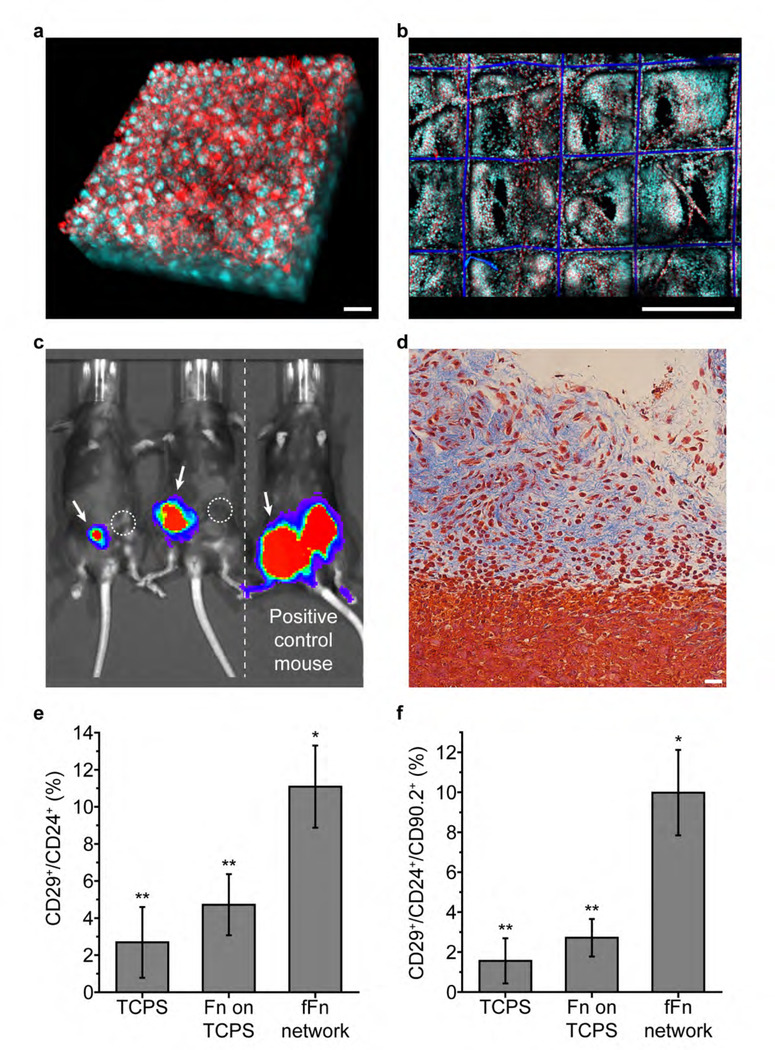
Figure 2. Engineered fFn networks enhance tumor engraftment efficiency in a mouse breast cancer model.
(a) AT-3 mouse breast cancer cells formed 3D cell volumes approximately 70 μm thick in vitro after three days on fFn networks. Scale bar 25 μm. (b) Large scale view shows that AT-3 cells in (a) proliferated and filled the 3D space within the fFn network. Scale bar 500 μm. (a-b) Channels: cyan, cell nucleus; red, actin. (c) Bioluminescence image of tumor formation in immune-competent mice 21 days after AT-3 cells were orthotopically implanted (image exposure time 10 seconds). Mice on the left after implantation of fFn networks carrying about 30,000 AT-3 cells into the mammary fat pads indicated by arrows (group 1). The contralateral mammary fat pad received an injection of approximately the same number of cells suspended in a Fn solution as indicated by circles (group 2). Mouse on the right is a positive control having received the group 3 fFn network in the left mammary fat pad (arrow), and the group 4 injection in the right, each delivering 200,000 AT-3 cells (the minimum required for tumor formation by cell injection[30]). (d) Mason’s Trichrome staining of a group 1 tumor graft that formed after 21 days showing AT-3 cells invading the surrounding tissues. Scale bar: 25 μm. Quantification of the (e) CD29+/CD24+ population capable of self-renewal (P<0.05) and (f) CD29+/CD24+/CD90.2+ tumor initiating population in AT-3s cultured three days on TCPS, TCPS with fibronectin conformally adsorbed (Fn on TCPS), or fFn networks. Single star indicates that the fFn network is statistically different from TCPS and Fn on TCPS; double star indicates that TCPS and Fn on TCPS are statistically similar.

