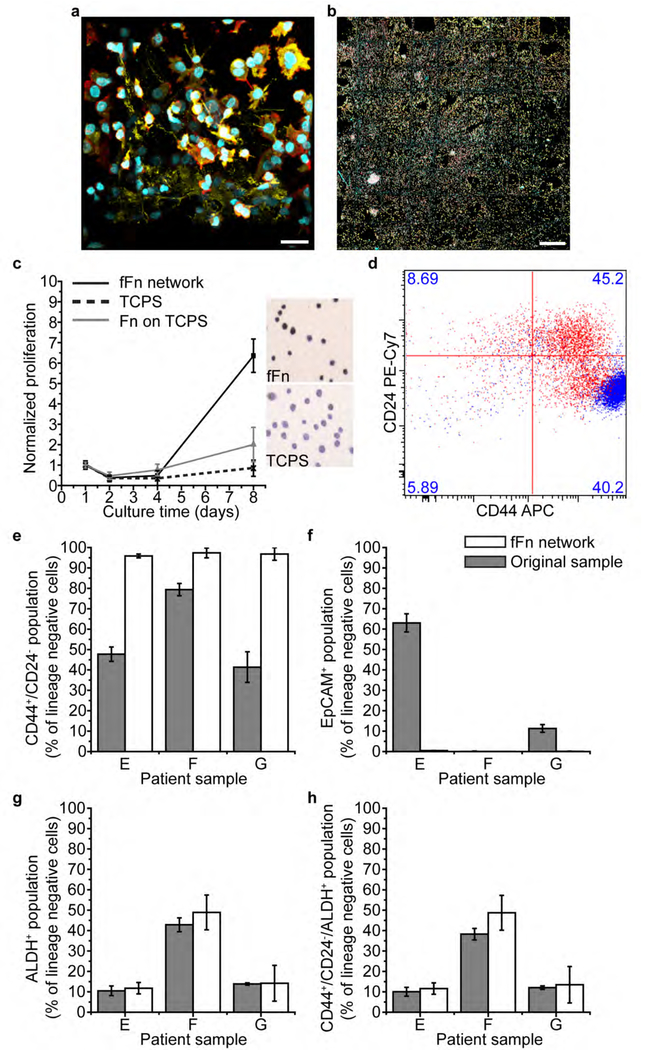
Figure 4. Engineered fFn networks enable expansion of patient breast cancer cells and enrich the tumor-initiating cell population in an epithelial to mesenchymal transition.
(a-b) Four-day culture of heterogenous cell populations from Patient E on fFn networks. Channels: cyan, cell nucleus; red, actin; yellow, cytokeratin 5. (a) 3D cell structures form within the pores and along the microfiber walls of the scaffold. Scale bar 25 μm. (b) Patient E cells fill fFn networks at large scale across all square 500 μm-wide pores of the tessellated scaffold. Scale bar 500 μm. (c) Patient cell proliferation measured via mitochondrial activity is far increased on fFn networks (black solid line and square marker) relative to the little to no growth on Fn adsorbed conformally onto TCPS (grey line and triangular marker), or TCPS alone (black dotted line and crisscross marker). Additionally, the inset shows representative images of Ki67 staining of patient cells cultured on either TCPS or fFn networks. Darker color indicates that the cells are in a proliferative state on fFn networks but senescent on TCPS. (d) Flow cytometry measurement of CD24 and CD44 in Patient E cells where the original sample is shown in red and the six-day in vitro culture on fFn networks is shown in blue. Cell phenotype concentrated towards CD44+/CD24− status after culture on fFn networks. (e-h) Flow cytometry measurements of the percentage of lineage negative cells that are (e) CD44+/CD24− (f) EpCAM+ (epithelial cell adhesion molecule) (g) ALDH+ (aldehyde dehydrogenase) and (h) CD44+/CD24−/ALDH+ within samples from Patients E, F, and G. Grey bars represent the original patient sample and white bars indicate result after cells were cultured on engineered fFn networks for six days.

