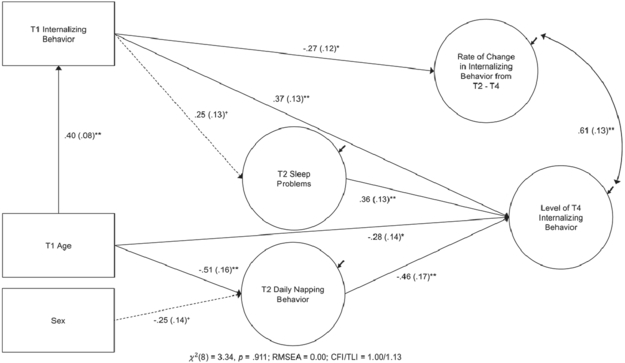
Figure 2.
Results for the conditional latent growth path model with sleep problems, daily napping behavior, and internalizing behavior while controlling for child age and sex. N = 123. Only paths with a p-value of < .10 shown. Solid arrows indicate paths significant at p < .05. Dashed arrows indicate paths trending toward significance at p < .10. Path coefficients standardized, standard errors in parentheses. T1 = baseline, T2 = 3 months post-baseline, T3 = 6 months post-baseline, T4 = 9 months post-baseline. Age = age in months. Sex dummy coded 0 = female, 1 = male. RMSEA = Root Mean Square Error. CFI = Comparative Fit Index. TLI = Tucker-Lewis Index. Observed T2 - T4 internalizing behavior variables omitted for clearer presentation.
+p < .10, *p < .05, **p < .01.

