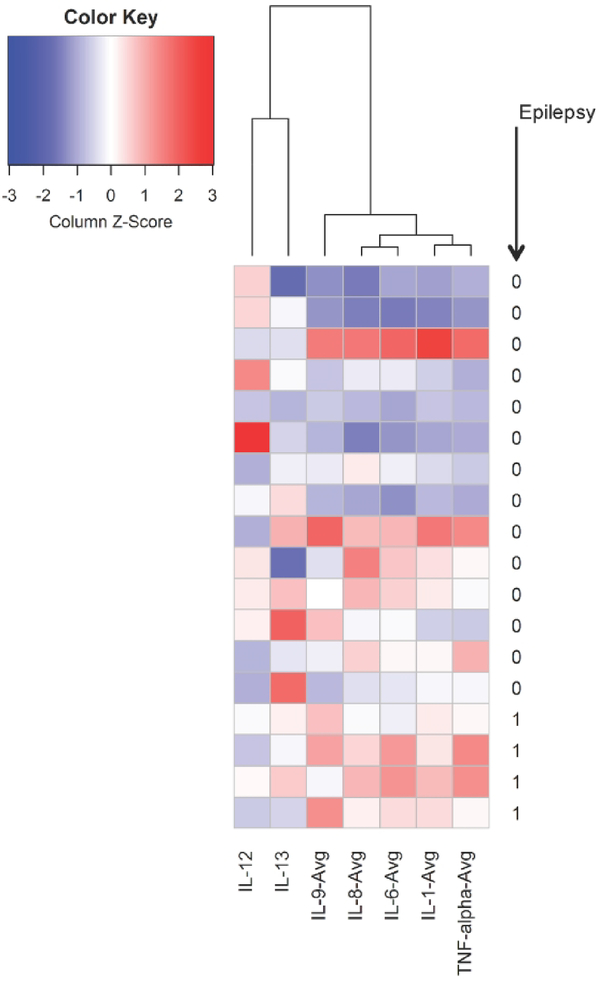
Figure 3:
Dendrogram and heatmap of neonatal cytokines levels in 26 neonates with neonatal encephalopathy using hierarchical agglomerative clustering. Children with epilepsy are denoted with “1” and children without epilepsy are denoted with “0”. Dark blue colors represent low cytokine values, white colors represent average values, and red represent high values.

